Data Visualizations

The following graph and maps show the data in Table 1 and Tables 2 and 3 in simplified forms. For more details on each state, please reference the tables.

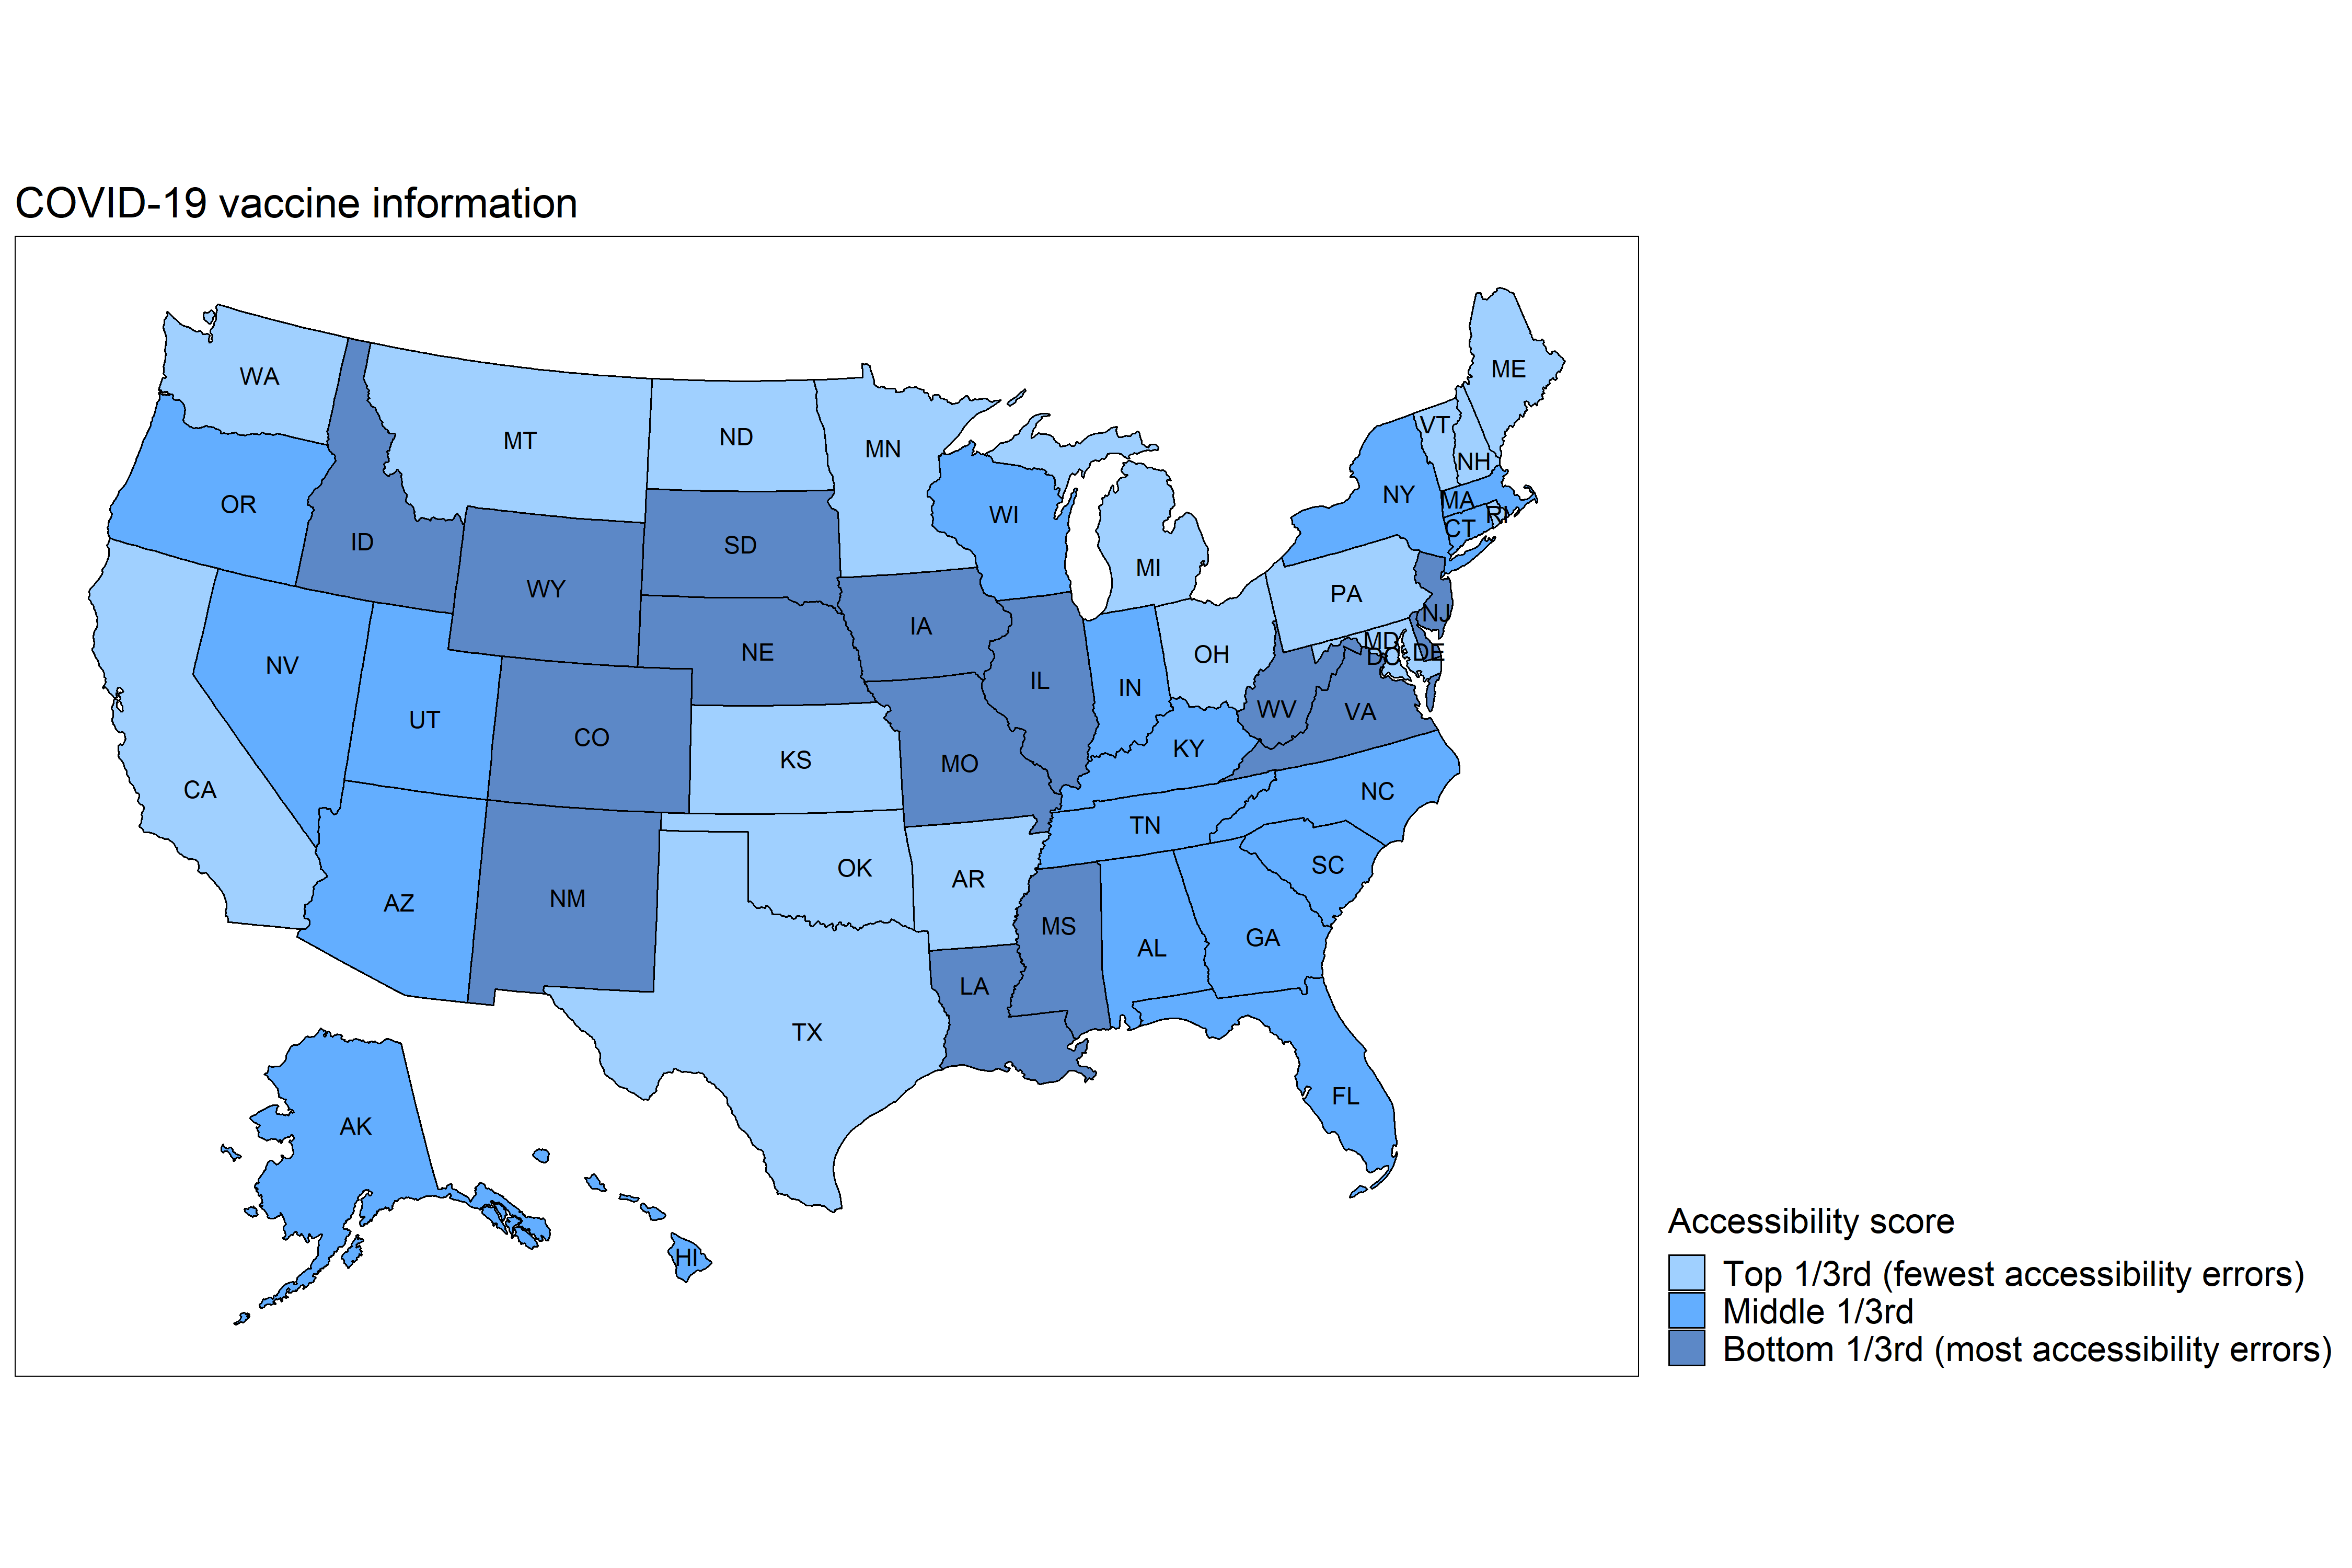
Figure 1: US maps showing accessibility scores for state vaccine websites as of 5-19-21:

State COVID-19 information sites:

A US map showing accessibility of state vaccine sites in tertiles each denoted by a different shade of blue.
1st tertile: Federal, Minnesota, Maine, Kansas, California, Arkansas, Washington, Maryland, New Hampshire, Texas, Oklahoma, Montana, Vermont, North Dakota, Rhode Island, Michigan, Pennsylvania, Ohio, U.S. Virgin Islands
2nd tertile: Florida, Oregon, Arizona, Alabama, Wisconsin, Indiana, Puerto Rico, Georgia, Utah, Kentucky, Connecticut, Nevada, North Carolina, Tennessee, Hawaii, New York, South Carolina, Massachusetts, Alaska
3rd tertile: Delaware, Nebraska, Northern Mariana Islands, Colorado, West Virginia, Iowa, District of Columbia, South Dakota, Louisiana, Missouri, Guam, Idaho, New Mexico, Virginia, American Samoa, Illinois, Wyoming, Mississippi, New Jersey

State vaccine registration sites:

A US map showing accessibility of state vaccine registration sites in tertiles each denoted by a different shade of blue.
1st tertile: Nevada, Maryland, Mississippi, Indiana, Alabama, California, Minnesota, New Jersey, District of Columbia, Ohio
2nd tertile: Arizona, Tennessee, Oklahoma, Delaware, Vermont, West Virginia, Wisconsin, Texas, Idaho, New York
3rd tertile: Nebraska, Missouri, Massachusetts, Georgia, Northern Mariana Islands, Illinois, New Hampshire, New Mexico, Florida

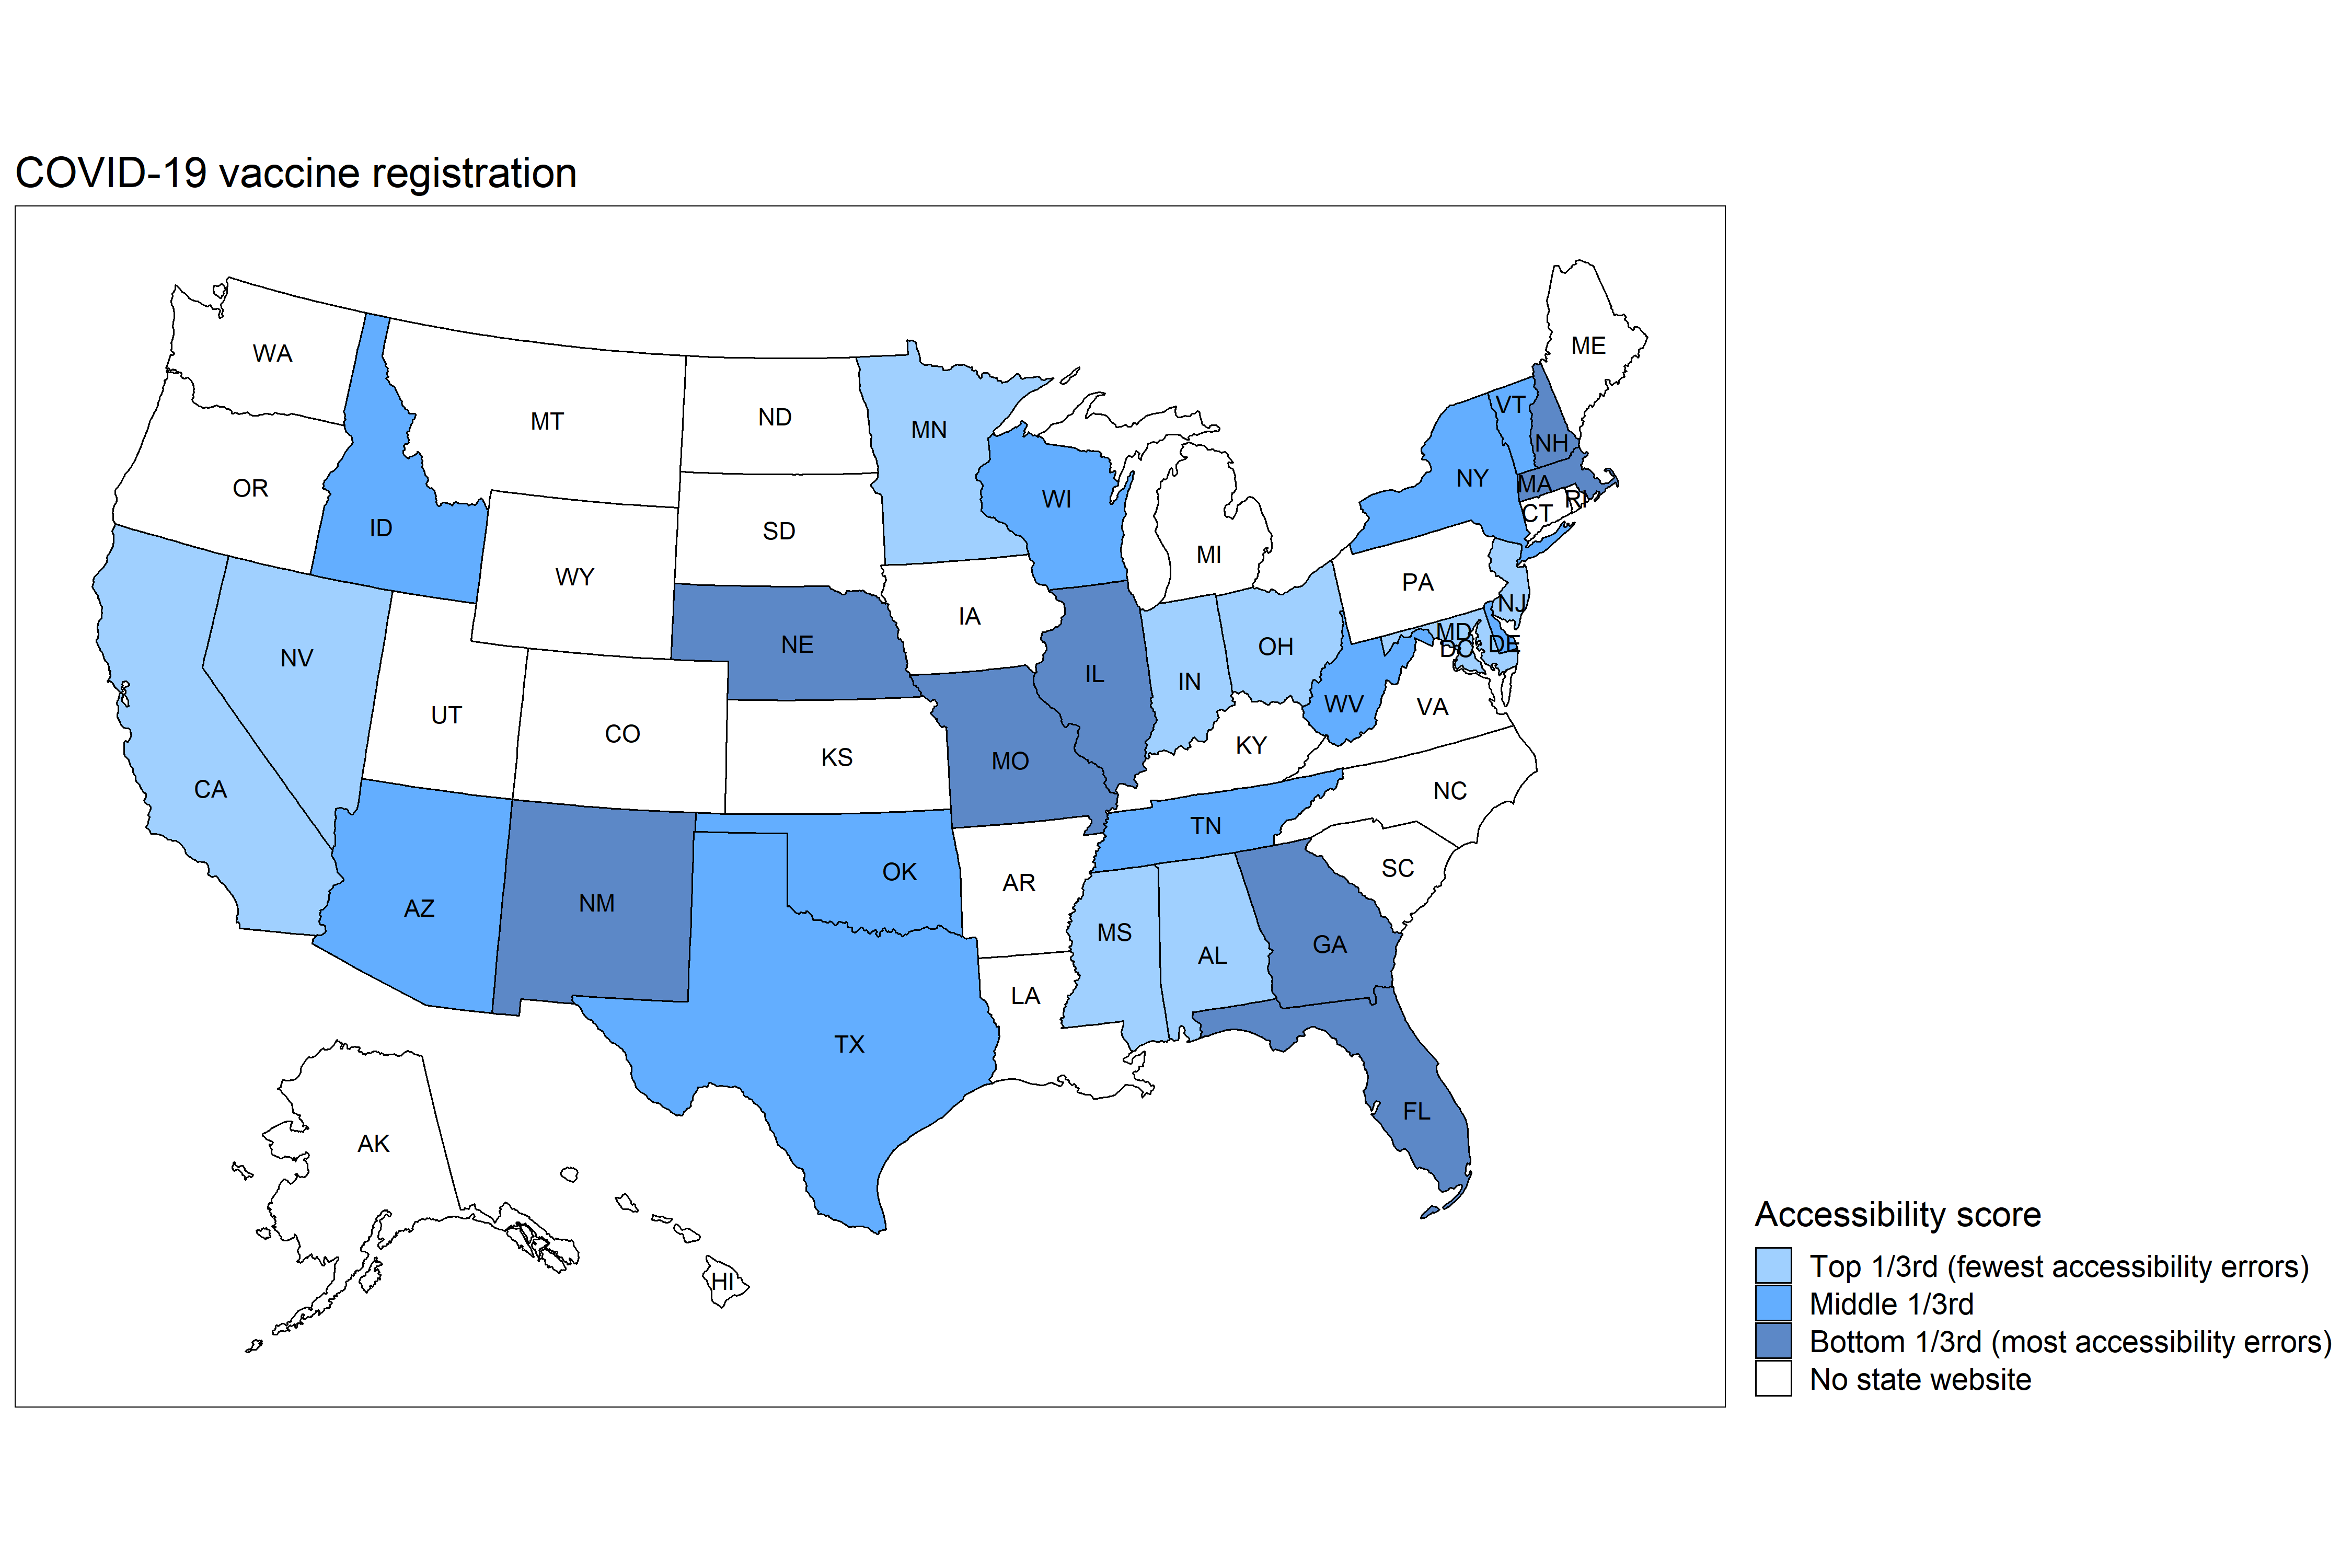
Note: Not all states have a centralized registration site. For more information, see the Vaccine Website Accessibility page.

Figure 2: Bar graph of current eligibility for disability-related groups as of 4-21-21 (no longer updated weekly):

A histogram with four sets of columns. The x-axis lists the eligibility group, and the y-axis shows the number of states and territories currently vaccinating this group. All categories have 100% eligible.

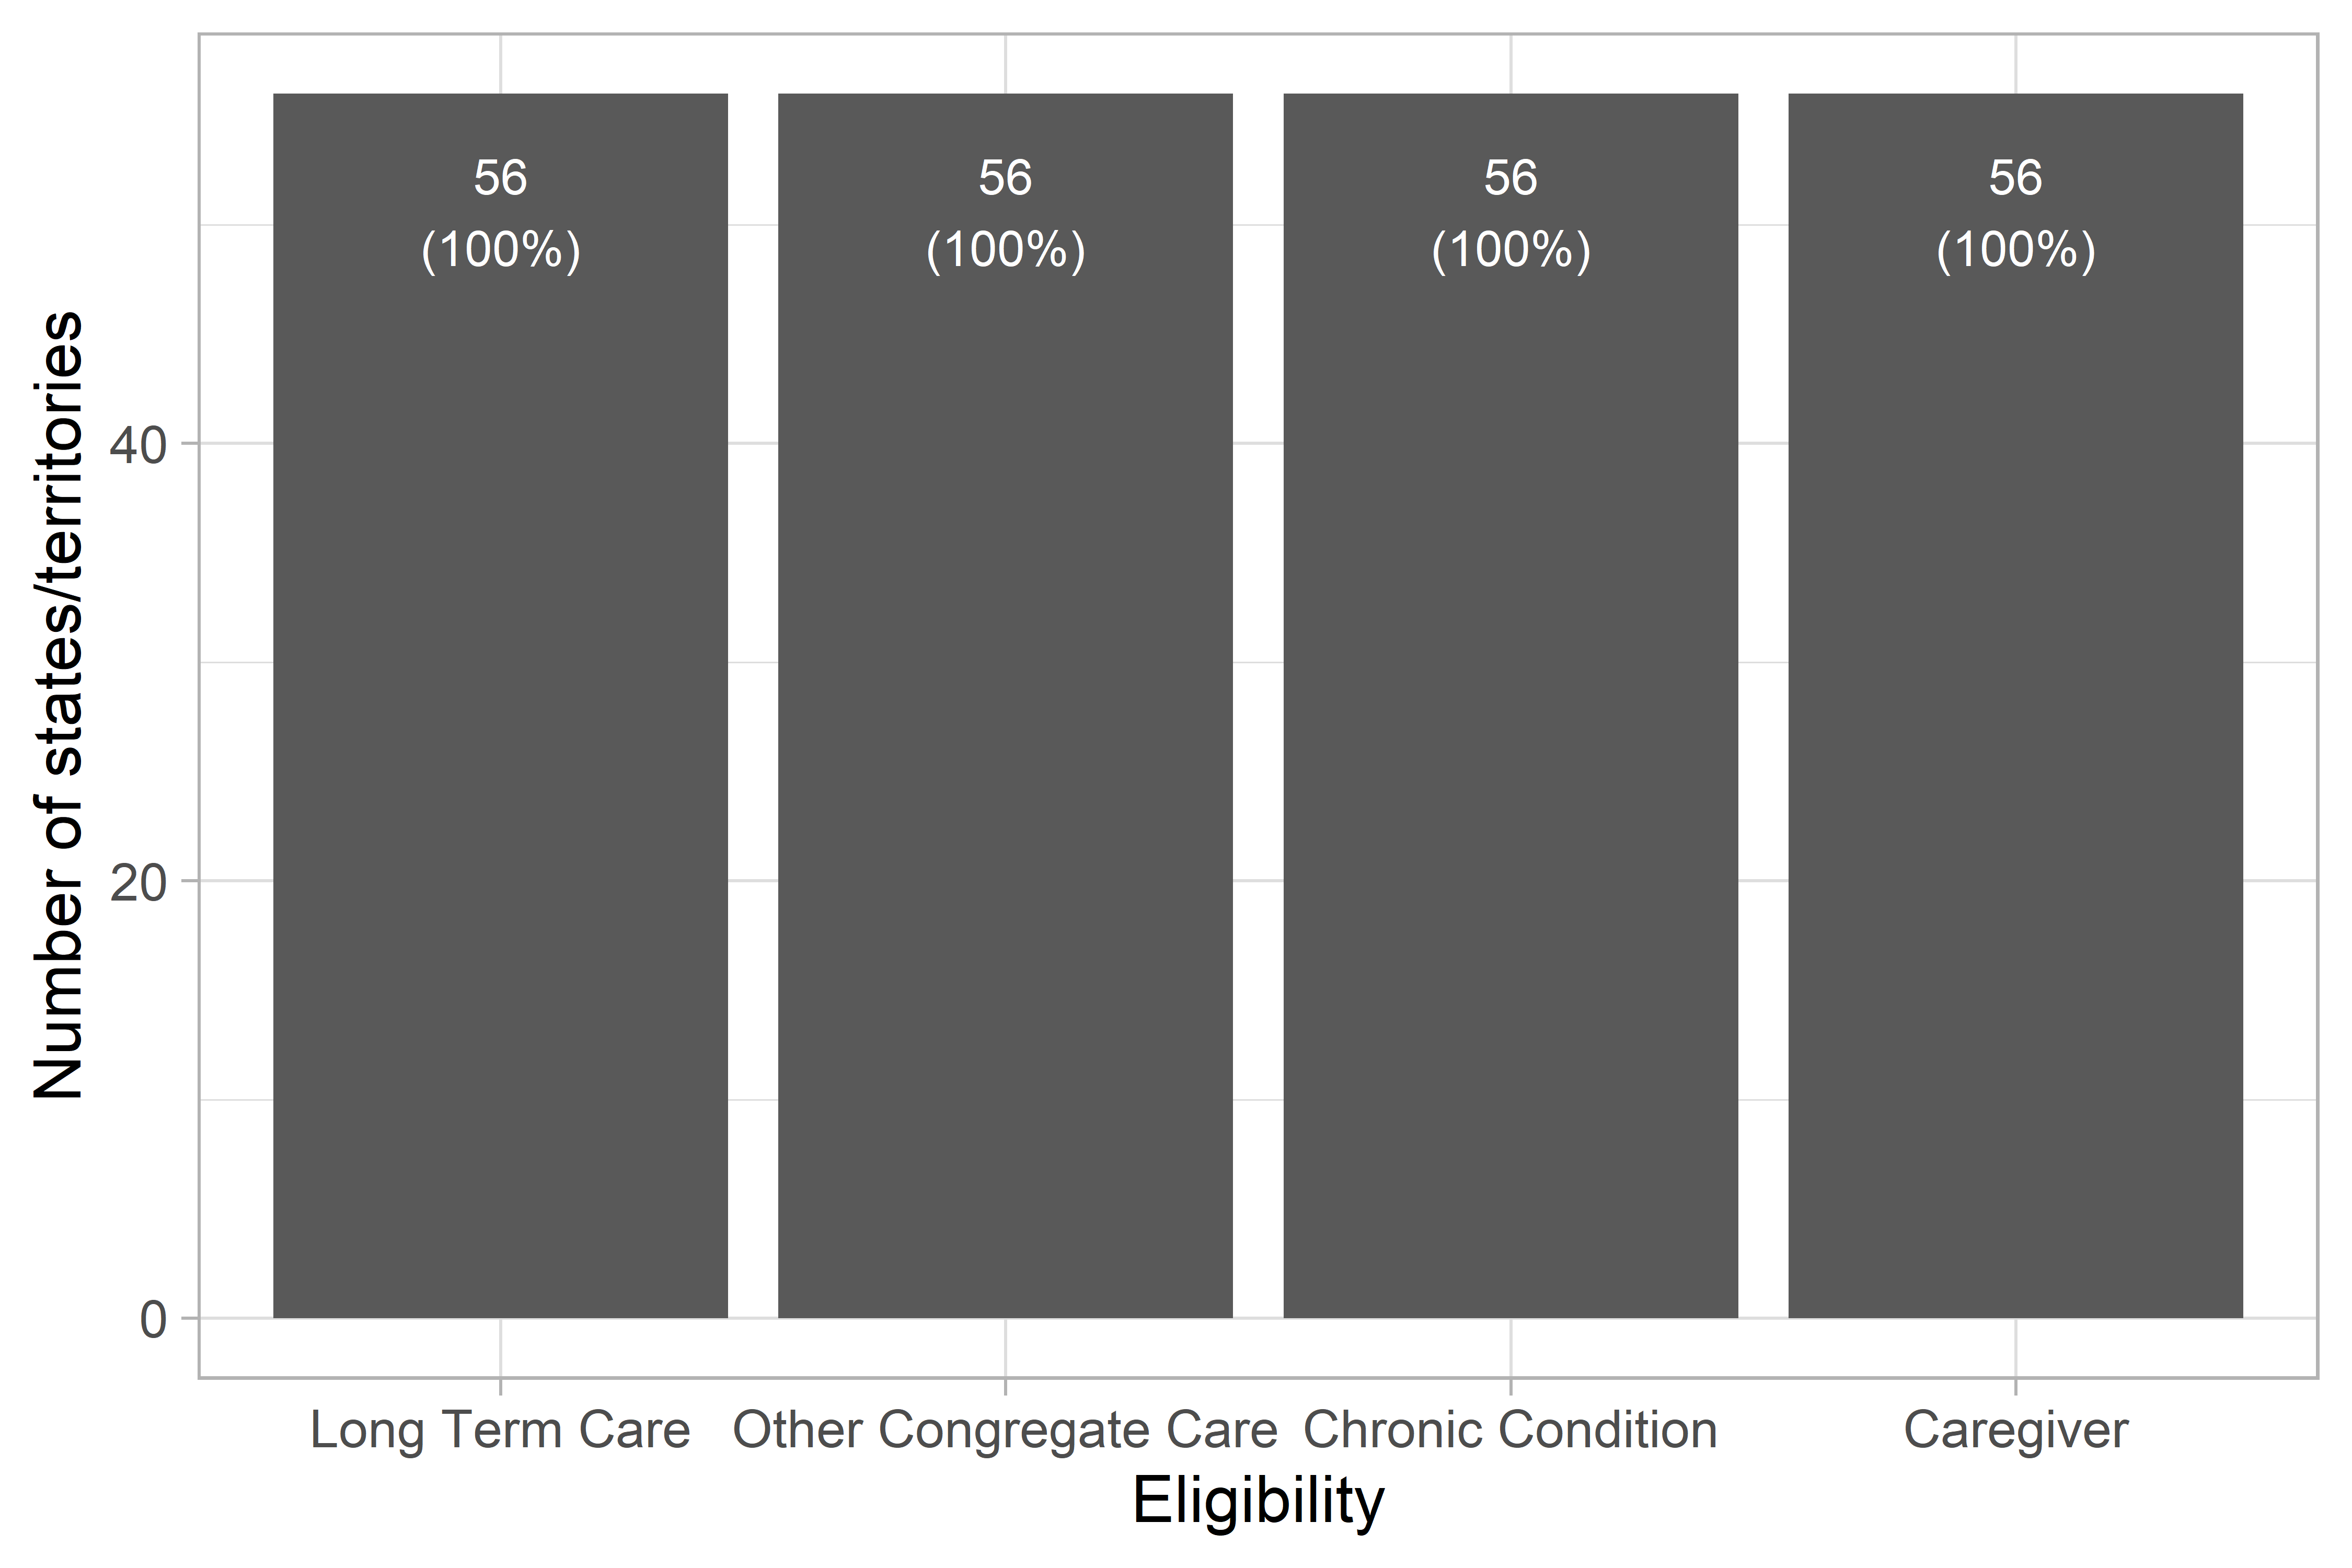
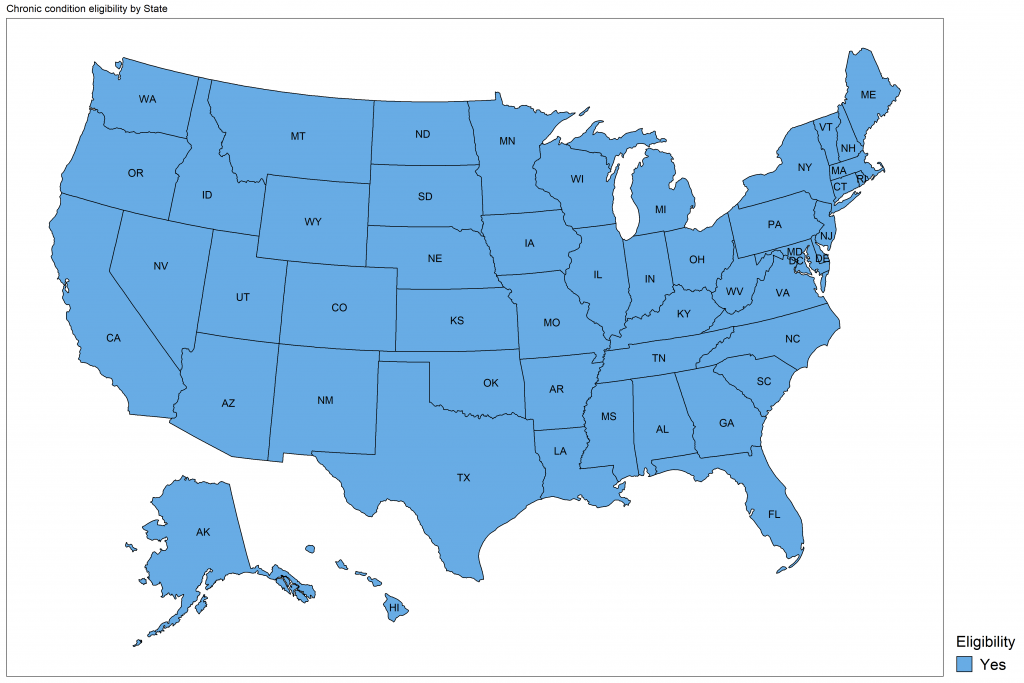
Figure 3: US maps showing current eligibility for disability-related groups as of 4-21-21 (no longer updated weekly):

To determine current eligibility, we compared the state’s current vaccine phase to the phase in which the specific group is prioritized. Please note that for some states, the group is divided over multiple phases, or the phase varies by county, so the inclusion in the graph and map denotes that at least some members of this group are eligible to be vaccinated in some parts of the state.

Long-term care settings:

A US map showing the 50 US states and District of Columbia. States are shaded in blue to denote that they are currently vaccinating this group, and this week, all states are shaded.

Other congregate care:

A US map showing the 50 US states and District of Columbia. States are shaded in blue to denote that they are currently vaccinating this group, and this week, all states are shaded.

Chronic conditions:

A US map showing the 50 US states and District of Columbia. States are shaded in blue to denote that they are currently vaccinating this group, and this week, all states are shaded.

Caregivers:

A US map showing the 50 US states and District of Columbia. States are shaded in blue to denote that they are currently vaccinating this group, and this week, all states are shaded.

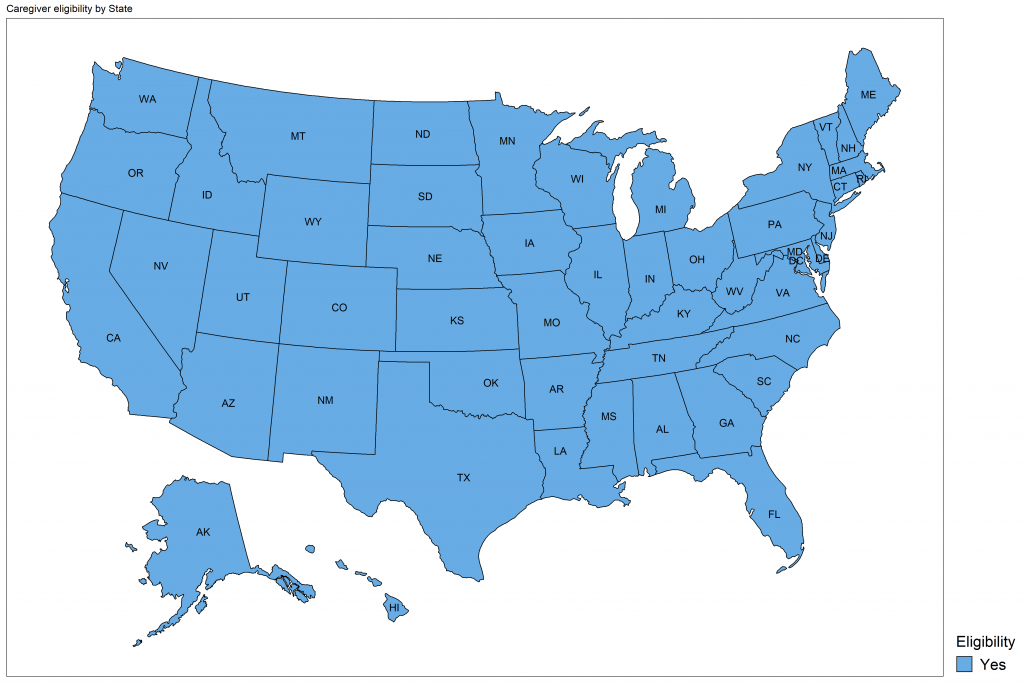
Note: The US maps show the 50 US states and the District of Columbia. For more information on the US territories, please reference Table 1.

Accessibility

The above graph and maps have alternative text embedded. We understand that visual representations of data may not be accessible to all, and that also, the table format may not be accessible to all. We strive to provide this data in multiple formats to maximize accessibility for people with different disabilities. For inquiries about accessibility, contact [email protected].