
The University Disability Dashboard scores universities across four categories. A summary of the methodology and limitations of this scoring system can be found below and on the University Scoring page page. Full details are outlined in the associated methodology paper.
- Accessibility of the built and virtual environment.
- Public image of disability inclusion.
- Accommodation request processes and procedures.
- Grievance policies related to disability accommodations.
Overall total scores are the sum of the four category scores (Table 1). A total of 100 points are possible for the overall scores. Higher scores indicate greater disability inclusion and accessibility. Overall letter grades are determined from overall total scores.
These scores are based on data collected from university webpages, as this is the information available to potential university applicants. The goal is to compare publicly available disability inclusion and accessibility information across universities and link this data to university-level federal funding. While this dashboard does not assess every aspect of disability inclusion, nor does a favorable score ensure an inclusive student experience, it identifies areas for improvement and can be used to track progress in the publicly provided information. Additional data is still needed to provide the full picture of disability inclusion and accessibility at universities.
The data presented on this dashboard are current as of November 15, 2021. This dashboard includes updated scores for some universities included in the prior dashboard release (see the Methodology section below for details).Figure 1. The Johns Hopkins Disability Health Research Center (DHRC) University Disability Inclusion Total Scores and Category Scores for the top 50 Undergraduate Universities by National Institutes of Health (NIH) Funding, November 2021
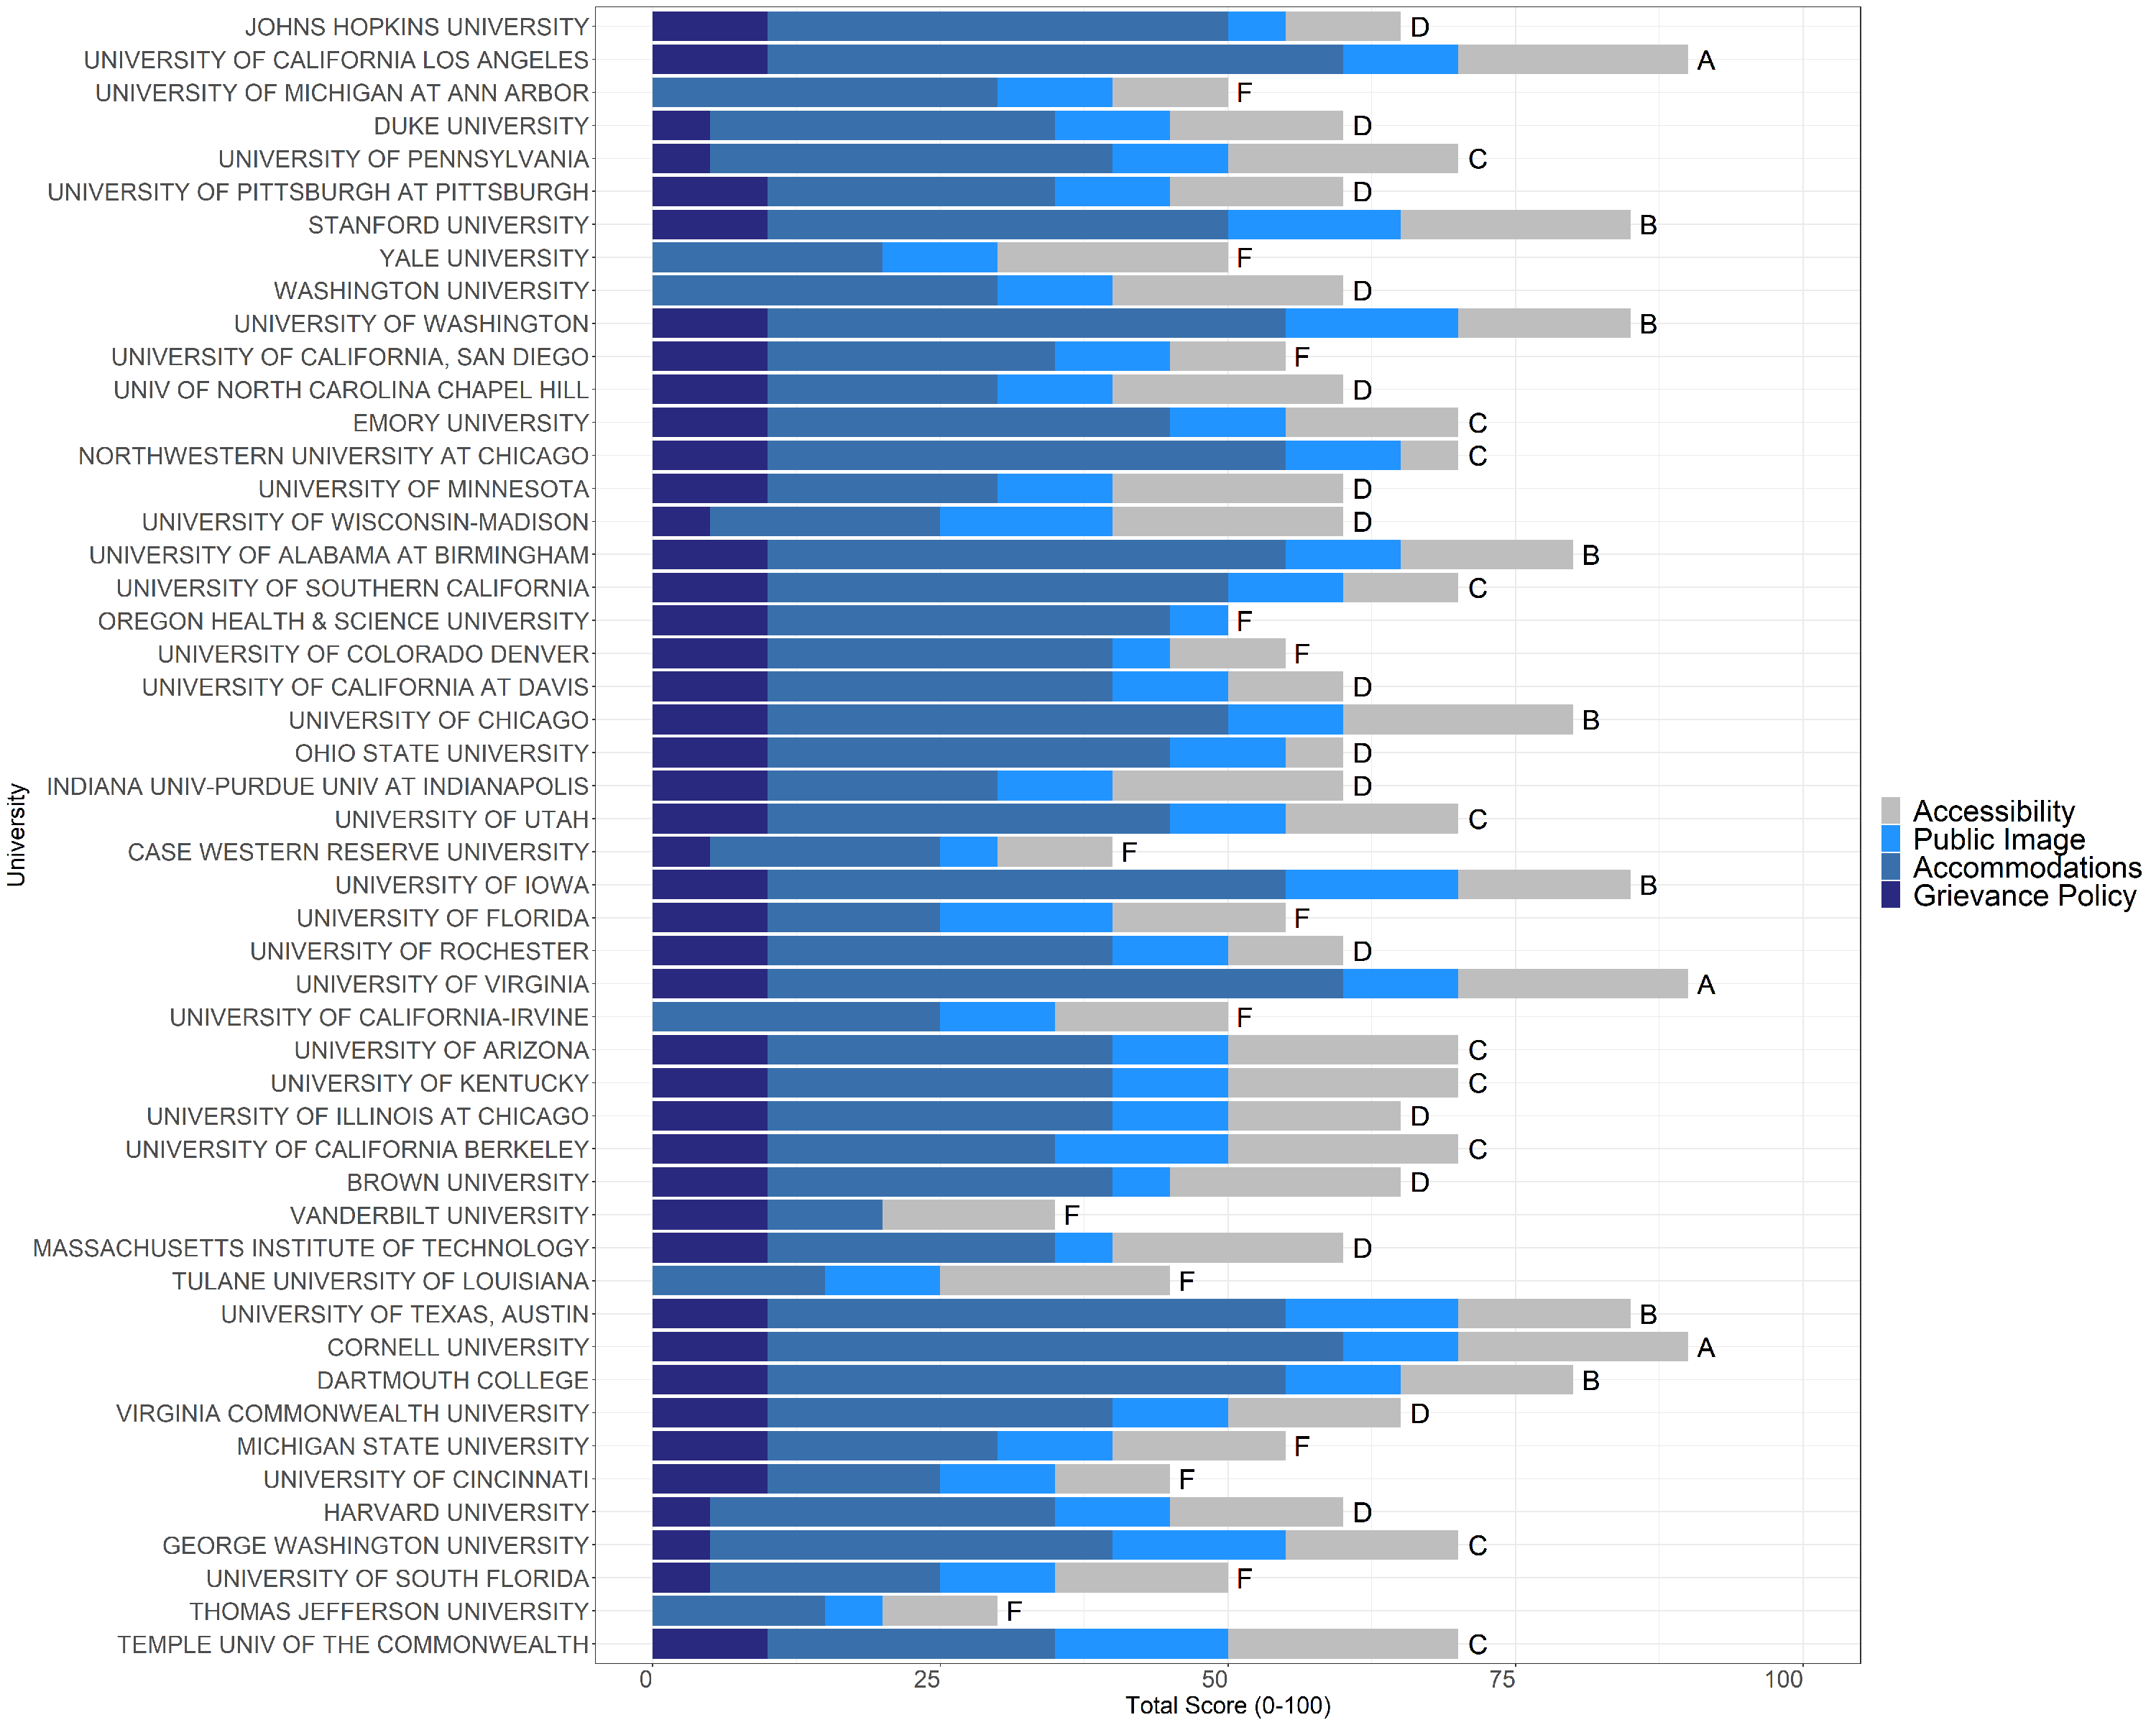
Results Summary
Based on overall accessibility and disability inclusion scores (Figure 1):
- 3 universities received an A (90 to 100 total points).
- 7 university received a B (80 to 89 total points).
- 10 universities received a C (70 to 79 total points).
- 16 universities received a D (60 to 69 total points).
- 14 universities received an F (less than 60 total points).
Higher NIH funding was not associated with better accessibility and disability inclusion scores (Table 1):
- Among the 5 universities with the most NIH funding, the average accessibility and disability inclusion score was 67 points (out of 100 points), and letter grades ranged from A to F.
- Among the 5 universities with the least NIH funding, the average accessibility and disability inclusion score was 56 points (out of 100 points), and letter grades ranged from C to F.
Based on the accessibility and disability inclusion sub-category scores (Table 1):
- Accessibility of the built and virtual environment: 19 universities scored 20 out of 20 points.
- Public image of disability inclusion: 0 universities scored 20 out of 20 points.
- Accommodation request processes and procedures: 3 universities scored 50 out of 50 points.
- Grievance policies related to disability accommodations: 37 universities scored 10 out of 10 points.
Table 1. The Johns Hopkins Disability Health Research Center (DHRC) University Disability Inclusion Total Scores and National Institutes of Health (NIH) Funding for Undergraduate Universities, November 2021
| wdt_ID | Funding Rank | University | NIH Funding (FY $, 2020) | Overall Grade (Letter Grade) | Overall Score (100 points) |
|---|---|---|---|---|---|
| 1 | 1 | JOHNS HOPKINS UNIVERSITY | $807,432,003 | D | 65 |
| 2 | 2 | UNIVERSITY OF CALIFORNIA LOS ANGELES | $673,201,228 | A | 90 |
| 3 | 3 | UNIVERSITY OF MICHIGAN AT ANN ARBOR | $641,965,656 | F | 50 |
| 4 | 4 | DUKE UNIVERSITY | $607,172,798 | D | 60 |
| 5 | 5 | UNIVERSITY OF PENNSYLVANIA | $593,605,914 | C | 70 |
| 6 | 6 | UNIVERSITY OF PITTSBURGH AT PITTSBURGH | $570,146,095 | D | 60 |
| 7 | 7 | STANFORD UNIVERSITY | $560,644,462 | B | 85 |
| 8 | 8 | YALE UNIVERSITY | $550,947,887 | F | 50 |
| 9 | 9 | WASHINGTON UNIVERSITY | $533,594,881 | D | 60 |
| 10 | 10 | UNIVERSITY OF WASHINGTON | $533,302,350 | B | 85 |
| 11 | 11 | UNIVERSITY OF CALIFORNIA, SAN DIEGO | $524,978,793 | F | 55 |
| 12 | 12 | UNIV OF NORTH CAROLINA CHAPEL HILL | $511,185,245 | D | 60 |
| 13 | 13 | EMORY UNIVERSITY | $507,546,965 | C | 70 |
| 14 | 14 | NORTHWESTERN UNIVERSITY AT CHICAGO | $367,414,121 | C | 70 |
| 15 | 15 | UNIVERSITY OF MINNESOTA | $340,417,756 | D | 60 |
| 16 | 16 | UNIVERSITY OF WISCONSIN-MADISON | $338,121,506 | D | 60 |
| 17 | 17 | UNIVERSITY OF ALABAMA AT BIRMINGHAM | $325,573,502 | B | 80 |
| 18 | 18 | UNIVERSITY OF SOUTHERN CALIFORNIA | $324,592,664 | C | 70 |
| 19 | 19 | OREGON HEALTH & SCIENCE UNIVERSITY | $304,670,088 | F | 50 |
| 20 | 20 | UNIVERSITY OF COLORADO DENVER | $292,134,808 | F | 55 |
| 21 | 21 | UNIVERSITY OF CALIFORNIA AT DAVIS | $254,622,553 | D | 60 |
| 22 | 22 | UNIVERSITY OF CHICAGO | $246,330,700 | B | 80 |
| 23 | 23 | OHIO STATE UNIVERSITY | $241,268,189 | D | 60 |
| 24 | 24 | INDIANA UNIV-PURDUE UNIV AT INDIANAPOLIS | $232,986,943 | D | 60 |
| 25 | 25 | UNIVERSITY OF UTAH | $228,951,281 | C | 70 |
| wdt_ID | Funding Rank | University | NIH Funding (FY $, 2020) | Accessibility (20 points) | Public Image (20 points) | Accommodations (50 points) | Grievance Policy (10 points) |
|---|---|---|---|---|---|---|---|
| 1 | 1 | JOHNS HOPKINS UNIVERSITY | $807,432,003 | 10 | 5 | 40 | 10 |
| 2 | 2 | UNIVERSITY OF CALIFORNIA LOS ANGELES | $673,201,228 | 20 | 10 | 50 | 10 |
| 3 | 3 | UNIVERSITY OF MICHIGAN AT ANN ARBOR | $641,965,656 | 10 | 10 | 30 | 0 |
| 4 | 4 | DUKE UNIVERSITY | $607,172,798 | 15 | 10 | 30 | 5 |
| 5 | 5 | UNIVERSITY OF PENNSYLVANIA | $593,605,914 | 20 | 10 | 35 | 5 |
| 6 | 6 | UNIVERSITY OF PITTSBURGH AT PITTSBURGH | $570,146,095 | 15 | 10 | 25 | 10 |
| 7 | 7 | STANFORD UNIVERSITY | $560,644,462 | 20 | 15 | 40 | 10 |
| 8 | 8 | YALE UNIVERSITY | $550,947,887 | 20 | 10 | 20 | 0 |
| 9 | 9 | WASHINGTON UNIVERSITY | $533,594,881 | 20 | 10 | 30 | 0 |
| 10 | 10 | UNIVERSITY OF WASHINGTON | $533,302,350 | 15 | 15 | 45 | 10 |
| 11 | 11 | UNIVERSITY OF CALIFORNIA, SAN DIEGO | $524,978,793 | 10 | 10 | 25 | 10 |
| 12 | 12 | UNIV OF NORTH CAROLINA CHAPEL HILL | $511,185,245 | 20 | 10 | 20 | 10 |
| 13 | 13 | EMORY UNIVERSITY | $507,546,965 | 15 | 10 | 35 | 10 |
| 14 | 14 | NORTHWESTERN UNIVERSITY AT CHICAGO | $367,414,121 | 5 | 10 | 45 | 10 |
| 15 | 15 | UNIVERSITY OF MINNESOTA | $340,417,756 | 20 | 10 | 20 | 10 |
| 16 | 16 | UNIVERSITY OF WISCONSIN-MADISON | $338,121,506 | 20 | 15 | 20 | 5 |
| 17 | 17 | UNIVERSITY OF ALABAMA AT BIRMINGHAM | $325,573,502 | 15 | 10 | 45 | 10 |
| 18 | 18 | UNIVERSITY OF SOUTHERN CALIFORNIA | $324,592,664 | 10 | 10 | 40 | 10 |
| 19 | 19 | OREGON HEALTH & SCIENCE UNIVERSITY | $304,670,088 | 0 | 5 | 35 | 10 |
| 20 | 20 | UNIVERSITY OF COLORADO DENVER | $292,134,808 | 10 | 5 | 30 | 10 |
| 21 | 21 | UNIVERSITY OF CALIFORNIA AT DAVIS | $254,622,553 | 10 | 10 | 30 | 10 |
| 22 | 22 | UNIVERSITY OF CHICAGO | $246,330,700 | 20 | 10 | 40 | 10 |
| 23 | 23 | OHIO STATE UNIVERSITY | $241,268,189 | 5 | 10 | 35 | 10 |
| 24 | 24 | INDIANA UNIV-PURDUE UNIV AT INDIANAPOLIS | $232,986,943 | 20 | 10 | 20 | 10 |
| 25 | 25 | UNIVERSITY OF UTAH | $228,951,281 | 15 | 10 | 35 | 10 |
| Funding Rank | University | NIH Funding (FY $, 2020) | Accessibility (20 points) | Public Image (20 points) | Accommodations (50 points) | Grievance Policy (10 points) |
Methodology
Table 1 shows the overall and category scores for each university. Data was collected from publicly available university webpages. Two independent researchers abstracted information from university websites following a standard procedure and disagreements in the data were adjudicated. These webpages included the main university homepage, the undergraduate admissions webpage, and the disability services office webpage.
Total amounts of National Institutes of Health (NIH) funding during fiscal year 2020 was determined from NIH Reporter. Only postsecondary institutions that offer undergraduate degree programs were included in these rankings.
For the top 25 universities, data was collected between June and October 2021. Data for the remaining 25 universities was collected between July and November 2021. Data was collected and adjudicated on a rolling basis. The virtual environment scores for all universities were updated on November 4, 2021, to reflect corrections in the calculation of the total accessibility scores. All scoring data was re-reviewed for this dashboard release. These updates resulted in changes in the scores for 15 universities from the initial dashboard released in October 2021.
The data presented on this dashboard are current as of November 15, 2021.
Limitations
These scores and NIH funding may change over time. Data was abstracted and adjudicated on a rolling basis between June and November 2021 and may not capture current university information or accessibility indicators.
These data only include information about policies, procedures, and accessibility that is publicly available on university websites. While this dashboard does not assess every aspect of disability inclusion, nor does a favorable score ensure an inclusive student experience, it identifies areas for improvement and can be used to track progress in publicly provided information.
Citation
The use of data, figures, or graphs from this dashboard should be cited as: The Johns Hopkins Disability Health Research Center University Disability Inclusion Dashboard. 2021. https://disabilityhealth.jhu.edu/
Contact Information
If you have questions or need the data in an alternate accessible format, contact us at: [email protected].