
The SNAP Disability Dashboard ranks Supplemental Nutrition Assistance Program (SNAP) enrollment websites by metrics of accessibility and disability-inclusive practices. These scores are based on data collected from SNAP webpages from each program, as this is the information available to potential applicants. A summary of the methods used is found on the SNAP Methods page, and full details are outlined in the associated methods paper. A compilation of SNAP resources for people with disabilities is listed on the Information page.
The SNAP enrollment information and process was scored across three areas:
- Flexibility: indicating the number of modalities for SNAP enrollment to support access to a wide range of individuals (e.g. online, telephone, TTY, etc.)
- Efficiency: determining how easily information about enrollment can be found on SNAP websites
- Accessibility: assessing the useability of SNAP website content by a wide range of people
Each category has a maximum score of 6 points. The Total SNAP Score is the sum of these three total sub-scores and has a maximum of 18 points. Higher scores indicate a more accessible SNAP website and more disability-inclusive SNAP enrollment information and practices.
There are likely additional barriers in the SNAP enrollment process not reflected by this data. For example, accommodations offered on a SNAP website may not be readily available during the enrollment process. While this dashboard does not assess every aspect of disability inclusion, nor does a favorable score ensure an inclusive SNAP enrollment experience, it identifies areas for improvement and can be used to track progress in the publicly provided information.
Additional data is still needed to provide the full picture of disability inclusion and accessibility throughout the SNAP enrollment process.
RESULTS SUMMARY
Data was collected from SNAP websites for all 50 U.S. states, the District of Columbia, and New York City.
Among the SNAP enrollment accessibility and disability inclusion Total Scores:
- Georgia had the highest score: 16.5 points
- South Dakota and West Virginia had the lowest score: 5.5 points
Based on the SNAP enrollment accessibility and disability inclusion sub-category scores (Table 1):
- Flexibility in SNAP Enrollment: 0 SNAP programs scored 6 out of 6 points
- Efficiency of SNAP Enrollment: 2 SNAP programs scored 6 out of 6 points
- Accessibility of SNAP Website: 31 SNAP programs scored 6 out of 6 points
Figure 1. SNAP Enrollment Accessibility and Disability Inclusion: Total Scores across the United States, 2021
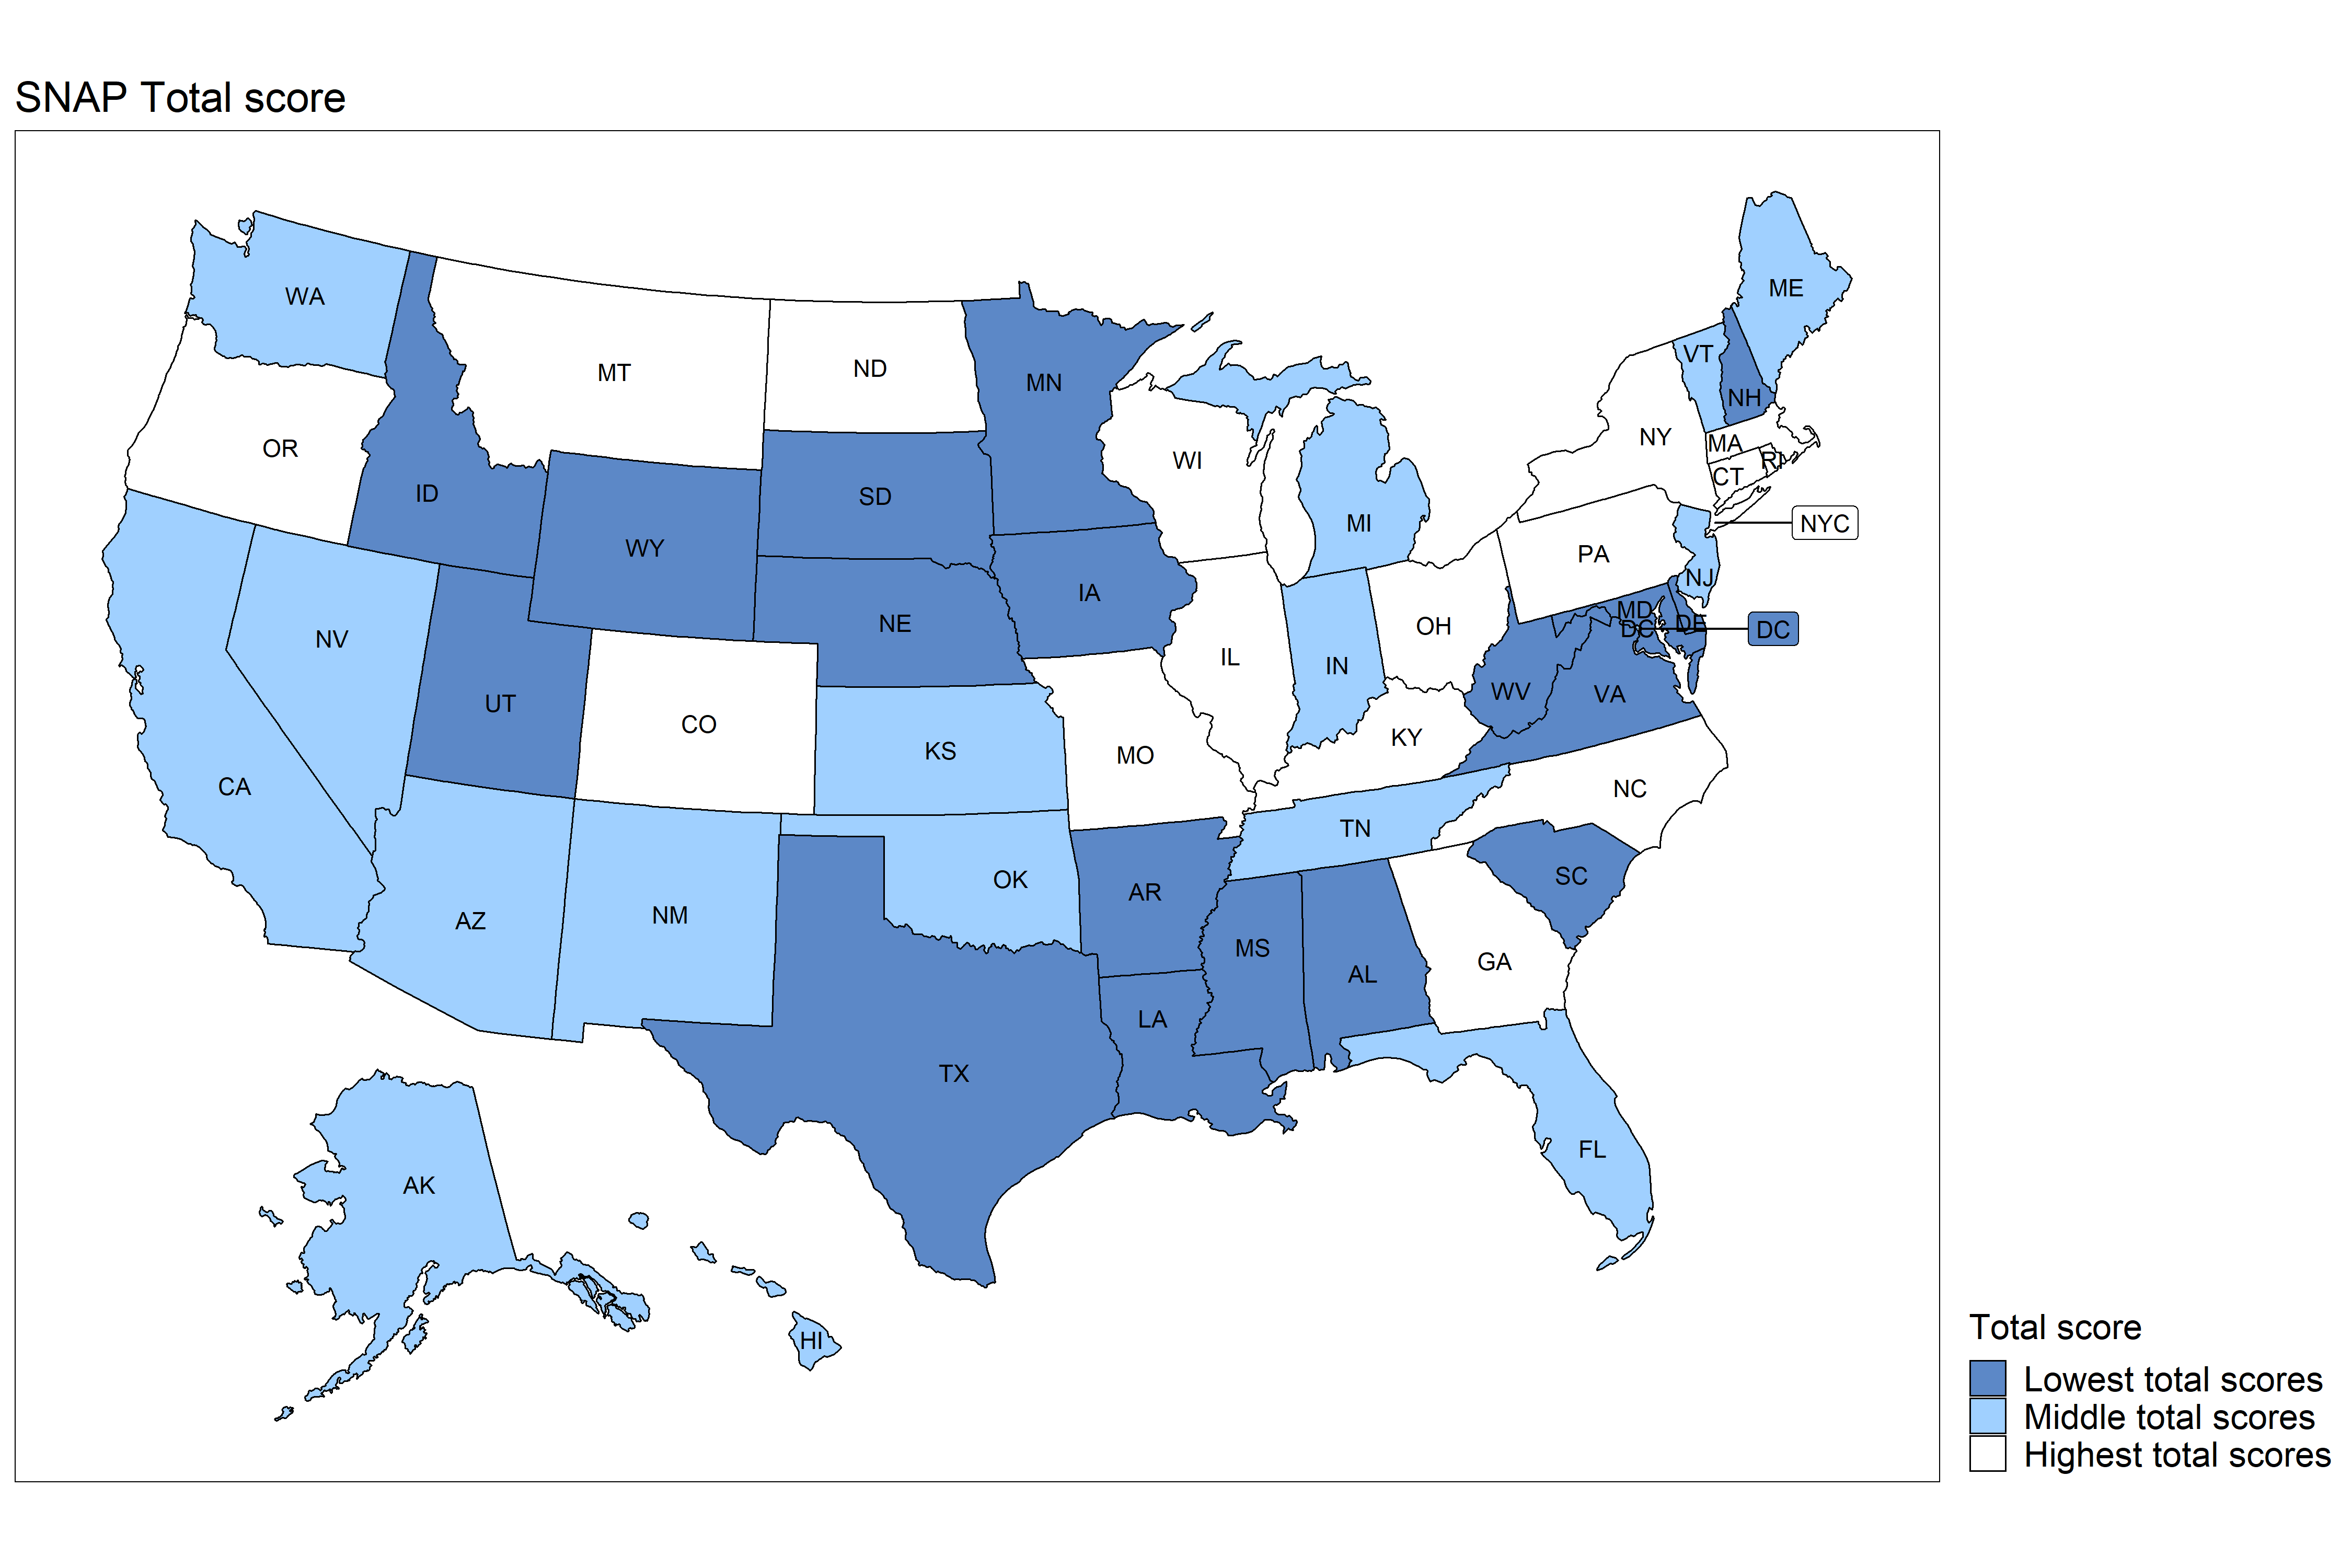
Figure 2. Flexibility in SNAP Enrollment Total Scores across the United States, 2021
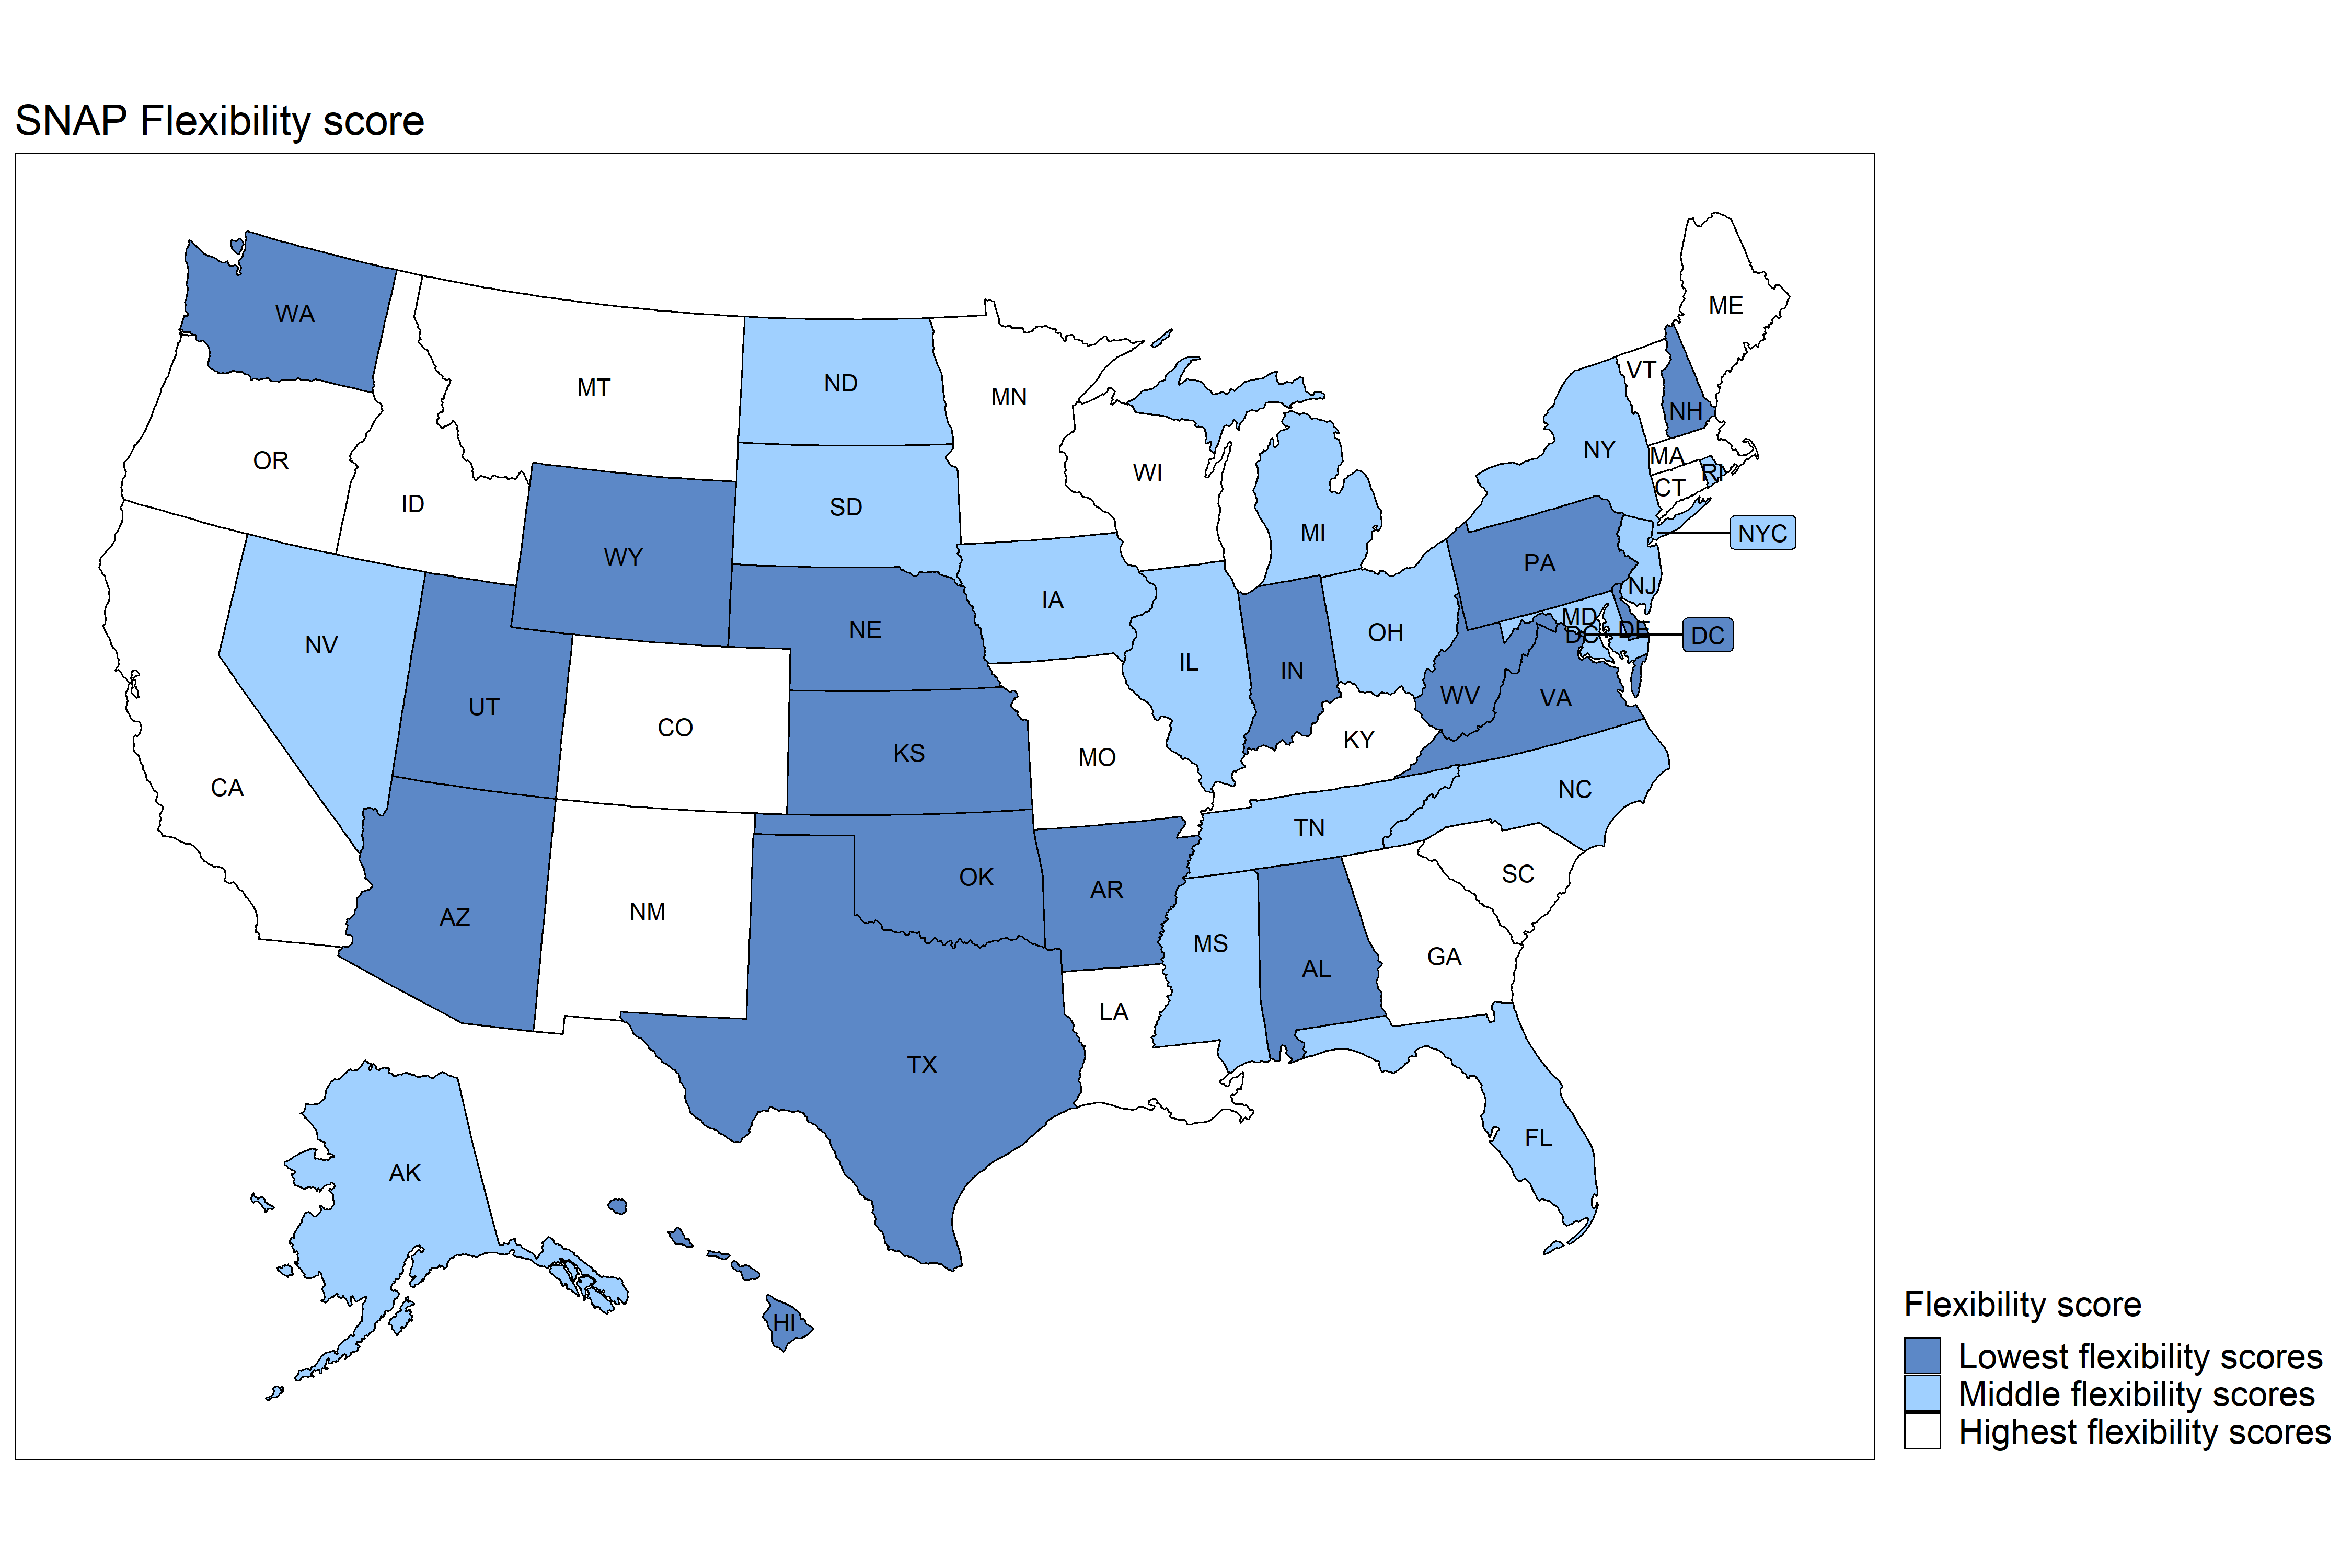
Figure 3. Efficiency of SNAP Enrollment Total Scores across the United States, 2021
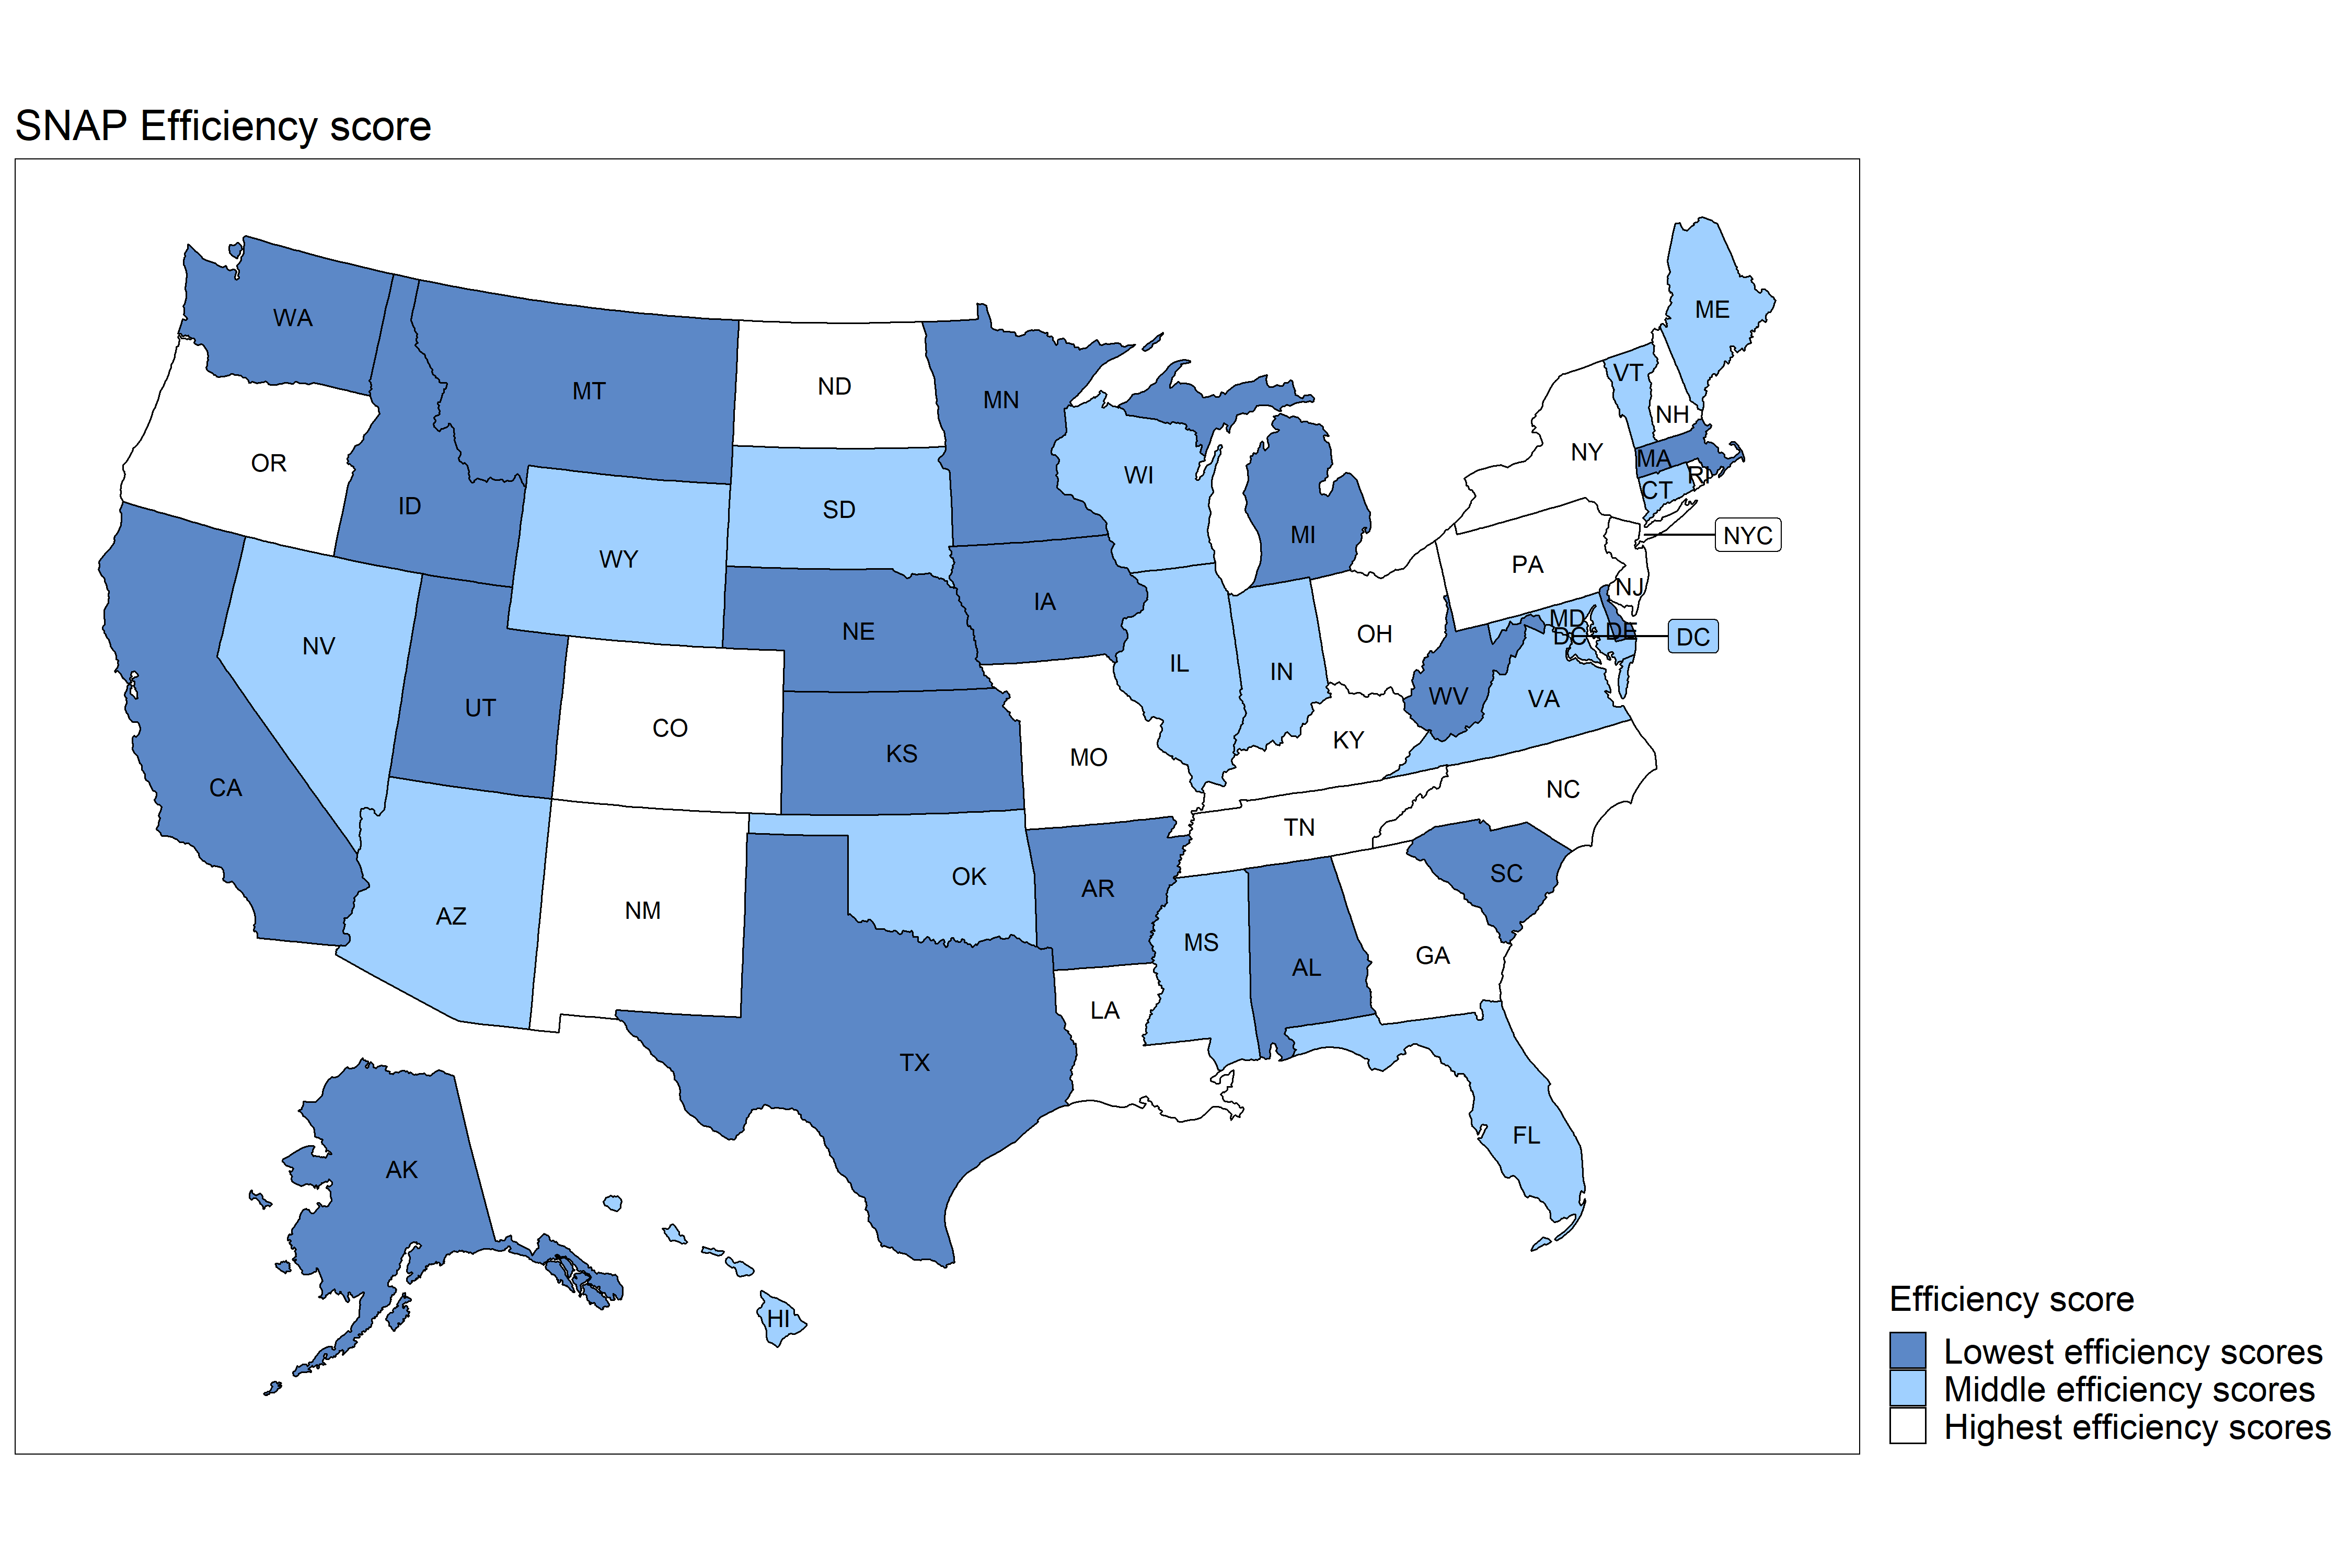
Figure 4. Accessibility of SNAP Websites Total Scores across the United States, 2021
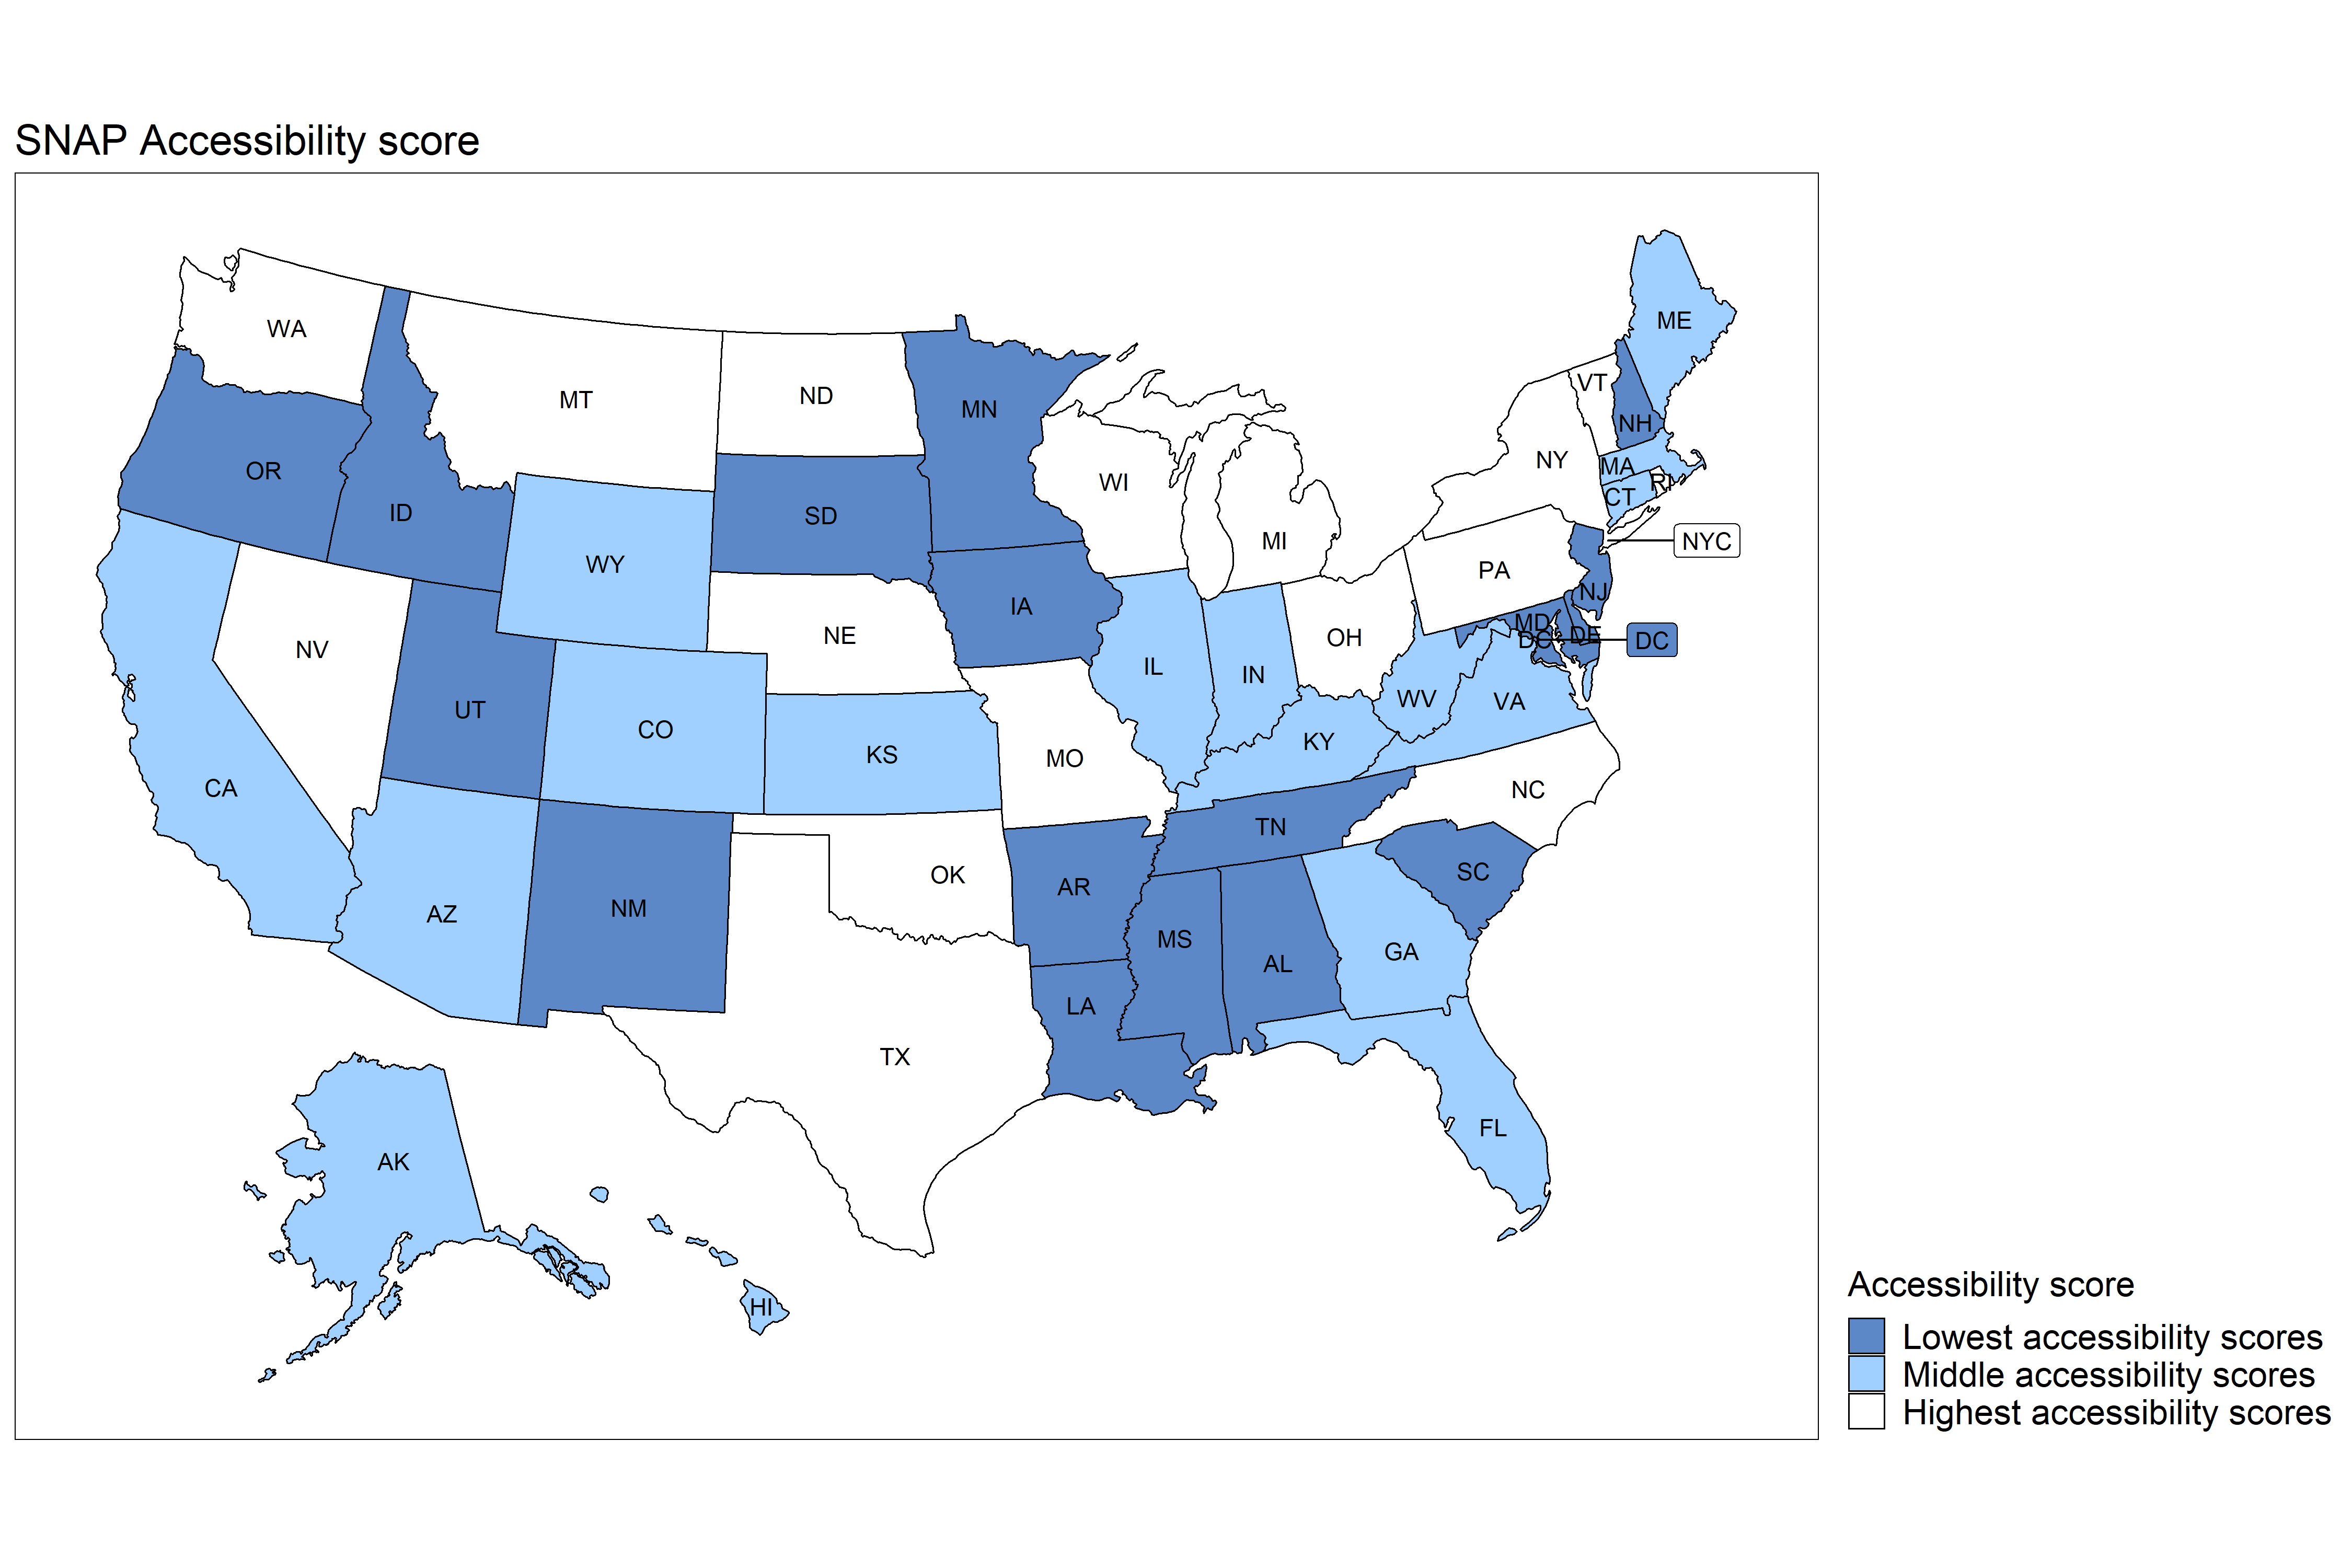
Table 1. SNAP Enrollment Accessibility and Disability Inclusion Total Scores across the United States, 2021
| wdt_ID | State | Total Score Rank | Total Score (18 pts max) | Flexibility Score Rank | Flexibility in SNAP Enrollment Score (6 pts max) | Efficiency Score Rank | Efficiency of SNAP Enrollment Score (6 pts max) | Accessibility Score Rank | SNAP Website Accessibility Score (6 pts max) |
|---|---|---|---|---|---|---|---|---|---|
| 1 | Alabama | 43 | 8.0 | 20 | 2.5 | 32 | 2.5 | 32 | 3.0 |
| 2 | Alaska | 24 | 11.0 | 13 | 3.0 | 43 | 2.0 | 1 | 6.0 |
| 3 | Arizona | 21 | 11.5 | 20 | 2.5 | 24 | 3.0 | 1 | 6.0 |
| 4 | Arkansas | 47 | 7.5 | 20 | 2.5 | 43 | 2.0 | 32 | 3.0 |
| 5 | California | 10 | 12.5 | 3 | 4.0 | 32 | 2.5 | 1 | 6.0 |
| 6 | Colorado | 3 | 14.5 | 9 | 3.5 | 3 | 5.0 | 1 | 6.0 |
| 7 | Connecticut | 4 | 14.0 | 3 | 4.0 | 11 | 4.0 | 1 | 6.0 |
| 8 | Delaware | 43 | 8.0 | 20 | 2.5 | 32 | 2.5 | 32 | 3.0 |
| 9 | District of Columbia | 32 | 9.5 | 20 | 2.5 | 11 | 4.0 | 32 | 3.0 |
| 10 | Florida | 10 | 12.5 | 13 | 3.0 | 21 | 3.5 | 1 | 6.0 |
| 11 | Georgia | 1 | 16.5 | 2 | 4.5 | 1 | 6.0 | 1 | 6.0 |
| 12 | Hawaii | 21 | 11.5 | 20 | 2.5 | 24 | 3.0 | 1 | 6.0 |
| 13 | Idaho | 39 | 8.5 | 3 | 4.0 | 50 | 1.5 | 32 | 3.0 |
| 14 | Illinois | 10 | 12.5 | 20 | 2.5 | 11 | 4.0 | 1 | 6.0 |
| 15 | Indiana | 28 | 10.5 | 48 | 1.0 | 21 | 3.5 | 1 | 6.0 |
| 16 | Iowa | 47 | 7.5 | 20 | 2.5 | 43 | 2.0 | 32 | 3.0 |
| 17 | Kansas | 32 | 9.5 | 48 | 1.0 | 32 | 2.5 | 1 | 6.0 |
| 18 | Kentucky | 2 | 15.0 | 3 | 4.0 | 3 | 5.0 | 1 | 6.0 |
| 19 | Louisiana | 35 | 9.0 | 1 | 5.0 | 11 | 4.0 | 51 | 0.0 |
| 20 | Maine | 20 | 12.0 | 13 | 3.0 | 24 | 3.0 | 1 | 6.0 |
| 21 | Maryland | 35 | 9.0 | 20 | 2.5 | 21 | 3.5 | 32 | 3.0 |
| 22 | Massachusetts | 10 | 12.5 | 3 | 4.0 | 32 | 2.5 | 1 | 6.0 |
| 23 | Michigan | 24 | 11.0 | 20 | 2.5 | 32 | 2.5 | 1 | 6.0 |
| 24 | Minnesota | 35 | 9.0 | 9 | 3.5 | 32 | 2.5 | 32 | 3.0 |
| 25 | Mississippi | 39 | 8.5 | 20 | 2.5 | 24 | 3.0 | 32 | 3.0 |
| State | Total Score Rank | Total Score (18 pts max) | Flexibility Score Rank | Flexibility in SNAP Enrollment Score (6 pts max) | Efficiency Score Rank | Efficiency of SNAP Enrollment Score (6 pts max) | Accessibility Score Rank | SNAP Website Accessibility Score (6 pts max) |
Citation
Citation for this data, figures, or graphs from this dashboard: The Johns Hopkins Disability Health Research Center SNAP Dashboard. https://disabilityhealth.jhu.edu
Contact Information
If you have questions or need the data in an alternate accessible format, you can contact us at [email protected].
To see if you qualify for SNAP, please contact your local SNAP office.